
Fig. s2
- ID
- ZDB-IMAGE-180327-11
- Publication
- Goodman et al., 2017 - Integrin α8 and Pcdh15 act as a complex to regulate cilia biogenesis in sensory cells
- All Figures
- Figures for Goodman et al., 2017
|
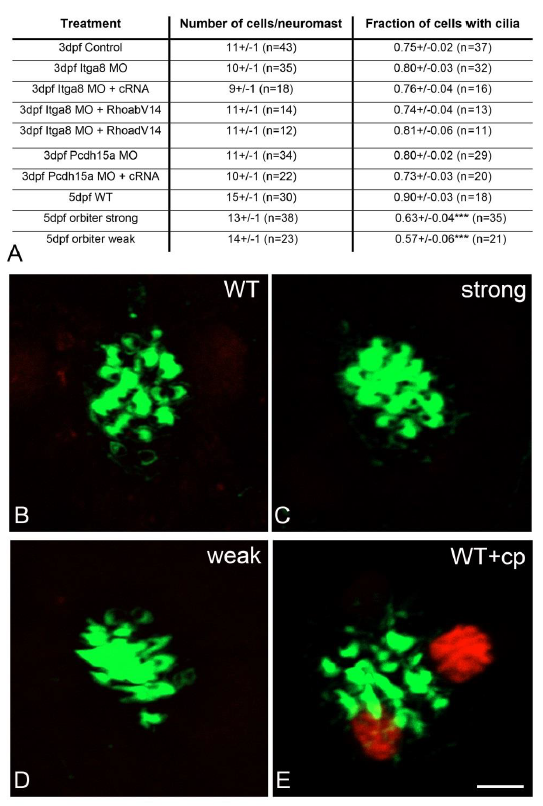
Fig. s2 Hair cell analysis in the MO and mutant animals. A: Number of cells per neuromast and the fraction of cells carrying cilium were quantified for each of the treatments (mean±SEM). One-way ANOVA followed by Dunnett’s multiple comparisons test was performed to compare number of cells per neuromast. Nonparametric Kruskal- Wallis test followed by Dunn’s multiple comparisons test was used to compare the proportion of ciliated hair cells. n: number of neuromast inspected from at least 3 independent experiments. ***p<0.001 versus WT. B-E: TUNEL labeling (red) of WT and orbiter neuromasts. Phalloidin (green) counterstained the hair cell bundle. WT+cp: Positive control: WT fish incubated with cisplatin. Scale: 4m.