
Fig. 4
- ID
- ZDB-IMAGE-180327-19
- Genes
- Antibodies
- Publication
- Goodman et al., 2017 - Integrin α8 and Pcdh15 act as a complex to regulate cilia biogenesis in sensory cells
- All Figures
- Figures for Goodman et al., 2017
|
Fig. 4
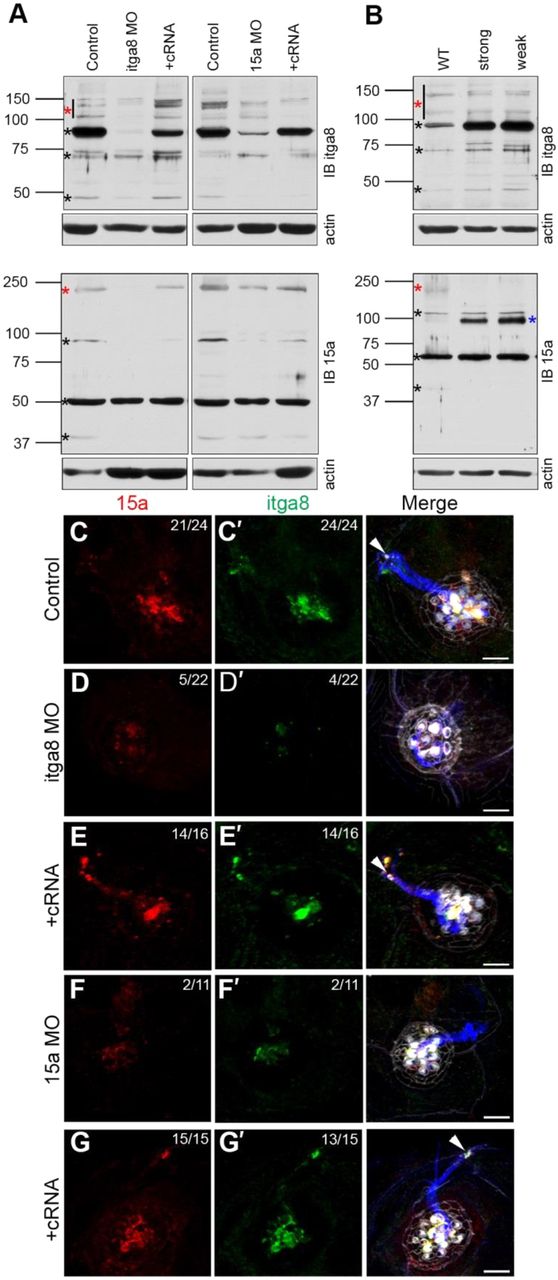
Interdependency of Itga8 and Pcdh15a protein expression and localization in hair cells. (A,B) Representative immunoblots from 3 dpf Pcdh15/Itga8 MOs (A) and 5 dpf pcdh15a mutants (B). (A) Expression of Itga8 and Pcdh15a was analyzed in controls, MOs (Itga8 MOs or 15a MOs) or MOs with the corresponding cRNA (+cRNA). (B) Expression of Itga8 and Pcdh15a was analyzed in WT and orbiter mutants. Red asterisks denote the full-length protein, black asterisks denote putative small protein variants. The blue asterisk denotes an additional variant not found in WT. Membranes were stripped and re-probed for actin as loading control. IB itga8, Itga8 immunoblot; IB 15a, Pcdh15a immunoblot. Three independent experiments were performed. (C–G′) Confocal images of 3 dpf controls (C,C′), MOs [Itga8 MOs or 15a MOs, (D,D′, F,F′) or MOs plus the corresponding cRNA (+cRNA; E,E′,G,G′)]. Larvae were immunostained for Pcdh15a (red), Itga8 (green) and acetylated tubulin (blue) and counterstained with phalloidin (gray). Arrowheads denote Itga8 and Pcdh15a colocalization at the tip of the cilia in controls and +cRNA MOs but not in MOs alone. Top right corner: number of neuromasts showing apical localization for the corresponding protein versus total number of neuromasts inspected. Two independent experiments were performed. Scale bars: 4.5 µm.