
- Title
-
Activation of the Nkx2.5-Calr-p53 signaling pathway by hyperglycemia induces cardiac remodeling and dysfunction in adult zebrafish.
- Authors
- Yanyi, S., Qiuyun, W., Yuehua, F., Chunfang, W., Guoping, L., Zhenyue, C.
- Source
- Full text @ Dis. Model. Mech.

ZFIN is incorporating published figure images and captions as part of an ongoing project. Figures from some publications have not yet been curated, or are not available for display because of copyright restrictions. |
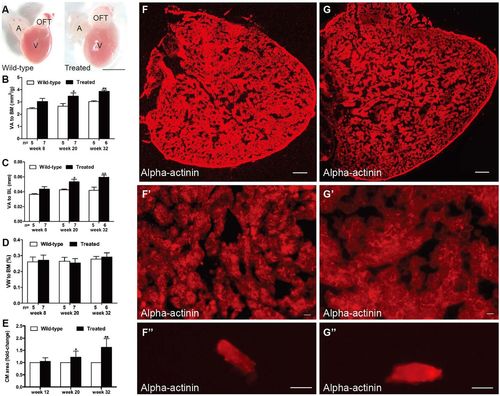
Hyperglycemia induced heart enlargement and myocardial hypertrophy. (A) Enlarged heart in the treated fish compared with the control group in week 20 (n=10 fish); scale bar: 1 mm. A, atria; OFT, outflow tract; V, ventricle. (B–D) Quantification of ventricular area to body mass (VA/BM) (B), ventricular area to body length (VA/BL) (C) and ventricular weight to body mass (VW/BM) (D) at different time points after glucose treatment. (E) Quantification of cardiomyocyte (CM) area indicated that CM size increased in the hearts of the treated fish from week 20. (F,G) Anti-alpha-actinin antibody staining showed enlarged ventricles in the treated fish (G) compared with that in the wild-type group (F) in week 32 (n=10 fish); scale bars: 100 μm. (F′,G′) Higher magnification images of ventricles in week 32 stained by anti-alpha-actinin antibody showed hypertrophic myocardium in the treated fish (G′) compared with that in the wild-type group (F′) (n=10 fish); scale bars: 10 μm. (F″,G″) Representative images of single CMs stained with anti-alpha-actinin antibody, dissociated from the hearts of the wild-type (F″) and treated (G″) fish in week 32 (n=10 fish); scale bars: 10 μm. Values are means±s.d. *P<0.05, **P<0.01 compared with the wild-type group. n, number of fish examined. PHENOTYPE:
|

Hyperglycemia induced muscular disarray, myofibril loss and apoptosis activation. (A,A′) H&E staining of ventricle sections showed muscular disarray and myofibril loss in treated fish (A′) compared with the wild-type group (A) after 32 weeks of treatment (n=20 field, repeated five times); scale bars: 100 μm. (A″) Quantification analysis of ventricular myocardial density in H&E-stained hearts between the two groups in weeks 8 and 32. (B,B′) TUNEL (green)-stained sectioned ventricles co-stained with Mef2 (red) of wild-type (B) and treated (B′) fish in week 32 (n=20 field, repeated five times); scale bars: 10 μm. Arrows: TUNEL+/Mef2+; arrowheads: TUNEL+/Mef2−. (B″) Measurement of the ratio of apoptotic nuclei [yellow (green plus red)] to total myocardial nuclei (red) between the two groups in weeks 8 and 32. (C,C′) Longitudinal TEM image verified muscular disarray and myofibril loss detected in the hearts of the treated fish (C′) compared with that in the wild-type group (C) (n=20 field, repeated five times); scale bars: 2 μm. (C″) Transverse TEM image showed myofibril loss (arrows) in the hearts of treated fish. Inset is a higher magnification image. Scale bar: 2 μm. (A″,B″) Values are means±s.d. **P<0.01 compared with the wild-type group. n, number of fish examined. PHENOTYPE:
|
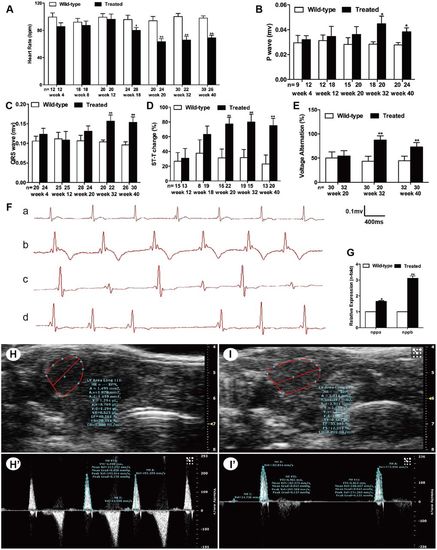
Hyperglycemia induced cardiac dysfunction. (A) Analysis of heart rate (HR) at different time points. (B) Analysis of P-wave amplitude at different time points. (C) Analysis of QRS-wave amplitude at different time points. (D) Percentage of ST-T change (T-wave inversion or ST-T depression). (E) Percentage of voltage alteration. (F) Typical ECG diagrams: a, normal ECG; b, T-wave inversion; c, voltage alteration; and d, prolonged PP interval (sinus arrest). (G) Real-time PCR analysis of the expression of nppa and nppb in wild-type and treated zebrafish in week 32. (H,I) Typical B-mode echocardiography images of wild-type (H) and treated (I) fish to evaluate ventricular morphology and function (n=20 fish). (H′,I′) Doppler-derived images of atrioventricular (AV) valve velocity of the wild-type (H′) and treated (I′) fish (n=20 fish). (A–F) Values are reported as means±s.d. (H–I′) Image data were automatically generated using the Vevo 2100 Workstation Software package. *P<0.05, **P<0.01 compared with the wild-type group. n, number of fish examined. |
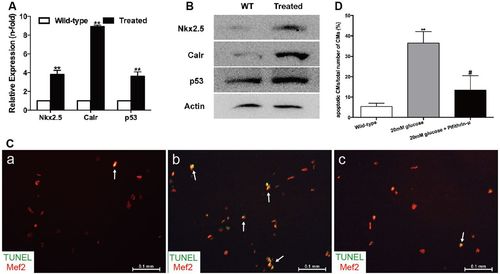
High glucose levels induced alterations of the Nkx2.5–Calr–p53 signaling pathway and apoptosis. (A) Real-time PCR analysis of the expression of Nkx2.5, Calr and p53 in the wild-type and treated fish in week 32 (n=8 fish per group). (B) Western blot analysis of the expression of Nkx2.5, Calr and p53 in wild-type (WT) and treated fish in week 32 (n=8 fish, repeated three times). (C) Merged images of cardiomyocytes (CMs) co-stained with Mef2 (red) and TUNEL (green) in the wild-type group (a), CMs exposed to 20 mM glucose (b) and CMs exposed to 20 mM glucose together with 10 μM pifithrin-μ (c) (n=20 field, repeated five times). Arrows: TUNEL+/Mef2+ CMs. Scale bars: 0.1 mm. (D) Quantitation of apoptotic CMs to total number of CMs in vitro of the three groups: CMs without any treatment, with 20 mM glucose, or with 20 mM glucose plus 10 μM pifithrin-μ (n=20 field per group, repeated five times). (A,D) Bars represent means±s.e.m. **P<0.01 compared with the wild-type group. #P<0.05 compared with 20 mM glucose group. |
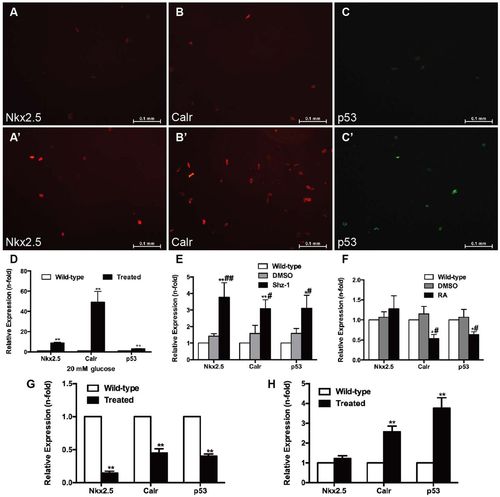
Effects of high glucose, drugs and cell infection on cardiomyocytes. (A–D) Cardiomyocytes (CMs) were incubated with 20 mM glucose for 24 h before analysis. (A,A′) Anti-Nkx2.5 antibody staining showing increased Nkx2.5 levels in glucose-treated CMs (A′) compared with the wild-type group (A) (n=20 field, repeated five times); scale bars: 0.1 mm. (B,B′) Anti-Calr antibody staining showed increased Calr levels in glucose-treated CMs (B′) compared with the wild-type group (B) (n=20 field, repeated five times); scale bars: 0.1 mm. (C,C′) Anti-p53 antibody staining showed increased p53 levels in glucose-treated CMs (C′) compared with the wild-type group (C) (n=20 field, repeated five times); scale bars: 0.1 mm. (D) Expression levels of Nkx2.5, Calr and p53 determined by real-time PCR. (E) Real-time PCR analysis of Nkx2.5, Calr and p53 in CMs exposed to 2.5 μM Shz-1 compared with the wild-type fish and DMSO control. (F) Real-time PCR analysis of Nkx2.5, Calr and p53 in CMs exposed to 1 μM retinoic acid (RA) compared with the wild-type fish and DMSO control. (G) Changes in Calr and p53 levels in CMs with altered expression of Nkx2.5. (H) Upregulation of Calr expression increased p53 levels in CMs. (D–H) Bars represent means±s.e.m. (n=5–6 fish per group). *P<0.05, **P<0.01 compared with the wild-type group. #P<0.05, ##P<0.01 compared with the DMSO control (0.1%). |
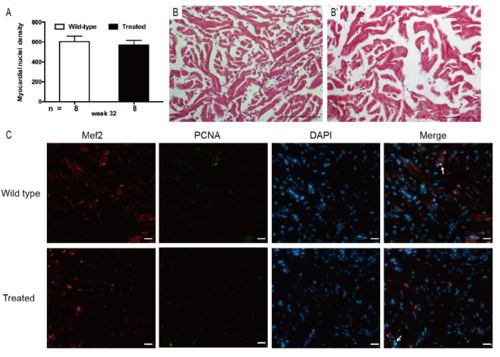
Supplementary Figure 1. (A) Myocardial nuclei density, defined as number of myocardial nuclei per field to myocardial density, showing no difference in two groups at week 32 (p > 0.05). (B) Masson’s staining did not show any interstitial fibrosis in the two groups (n = 15 field, repeated five times); scale bar = 100μm. (C) Co-staining of PCNA (green), Mef2 (red) with DAPI (blue) on cryosections of adult zebrafish hearts, indicating no significant difference in PCNA staining between wild-type and treated group (n = 15 field, repeated five times); scale bar = 10μm;Arrows: PCNA+/Mef2+/DAPI+. (A) Bars represent mean ± standard error of the mean, n = number of fish examined. |
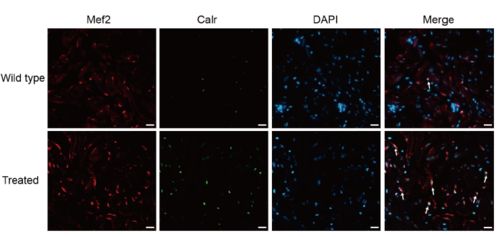
Supplementary Figure 2. Co-staining of Calr (green), Mef2 (red) with DAPI (blue) on cryosections of adult zebrafish hearts, indicating increased Calr expression on cardiomyocytes of treated fish compared with the wild-type (n = 15 field, repeated five times); scale bar = 10μm;Arrows: Calr+/Mef2+/DAPI+ (white, green and red plus blue). |
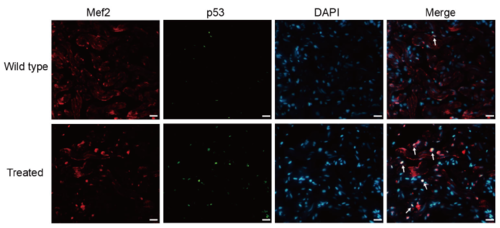
Supplementary Figure 3. Co-staining of p53 (green), Mef2 (red) with DAPI (blue) on cryosections of adult zebrafish hearts, indicating increased p53 expression on cardiomyocytes of treated fish compared with the wild-type (n = 15 field, repeated five times); scale bar = 10μm;Arrows: p53+/Mef2+/DAPI+ (white, green and red plus blue). |