
|
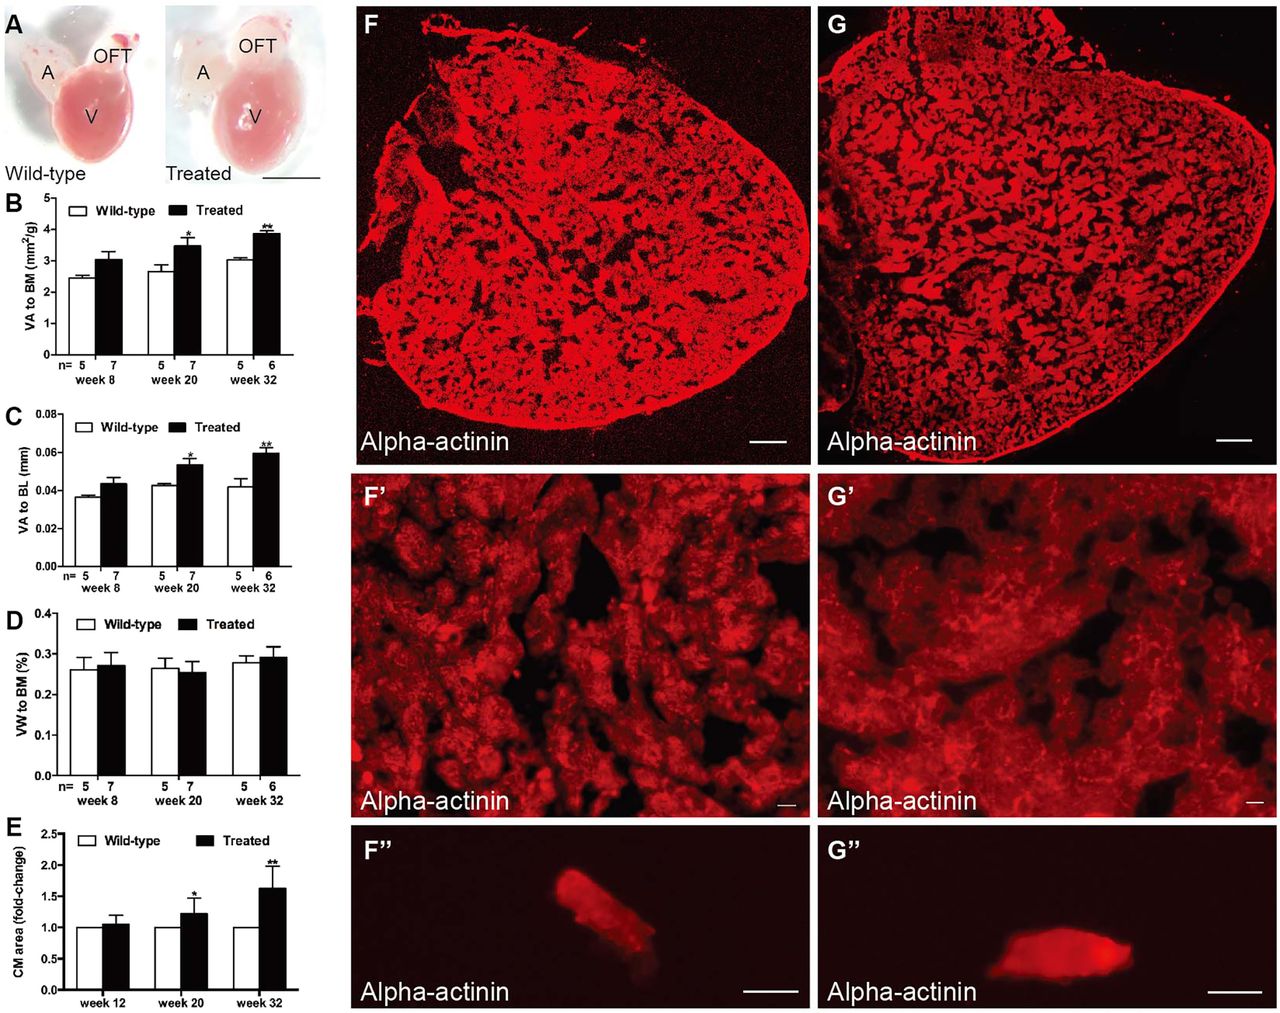
Fig. 2
Hyperglycemia induced heart enlargement and myocardial hypertrophy. (A) Enlarged heart in the treated fish compared with the control group in week 20 (n=10 fish); scale bar: 1 mm. A, atria; OFT, outflow tract; V, ventricle. (B–D) Quantification of ventricular area to body mass (VA/BM) (B), ventricular area to body length (VA/BL) (C) and ventricular weight to body mass (VW/BM) (D) at different time points after glucose treatment. (E) Quantification of cardiomyocyte (CM) area indicated that CM size increased in the hearts of the treated fish from week 20. (F,G) Anti-alpha-actinin antibody staining showed enlarged ventricles in the treated fish (G) compared with that in the wild-type group (F) in week 32 (n=10 fish); scale bars: 100 μm. (F′,G′) Higher magnification images of ventricles in week 32 stained by anti-alpha-actinin antibody showed hypertrophic myocardium in the treated fish (G′) compared with that in the wild-type group (F′) (n=10 fish); scale bars: 10 μm. (F″,G″) Representative images of single CMs stained with anti-alpha-actinin antibody, dissociated from the hearts of the wild-type (F″) and treated (G″) fish in week 32 (n=10 fish); scale bars: 10 μm. Values are means±s.d. *P<0.05, **P<0.01 compared with the wild-type group. n, number of fish examined.