
|
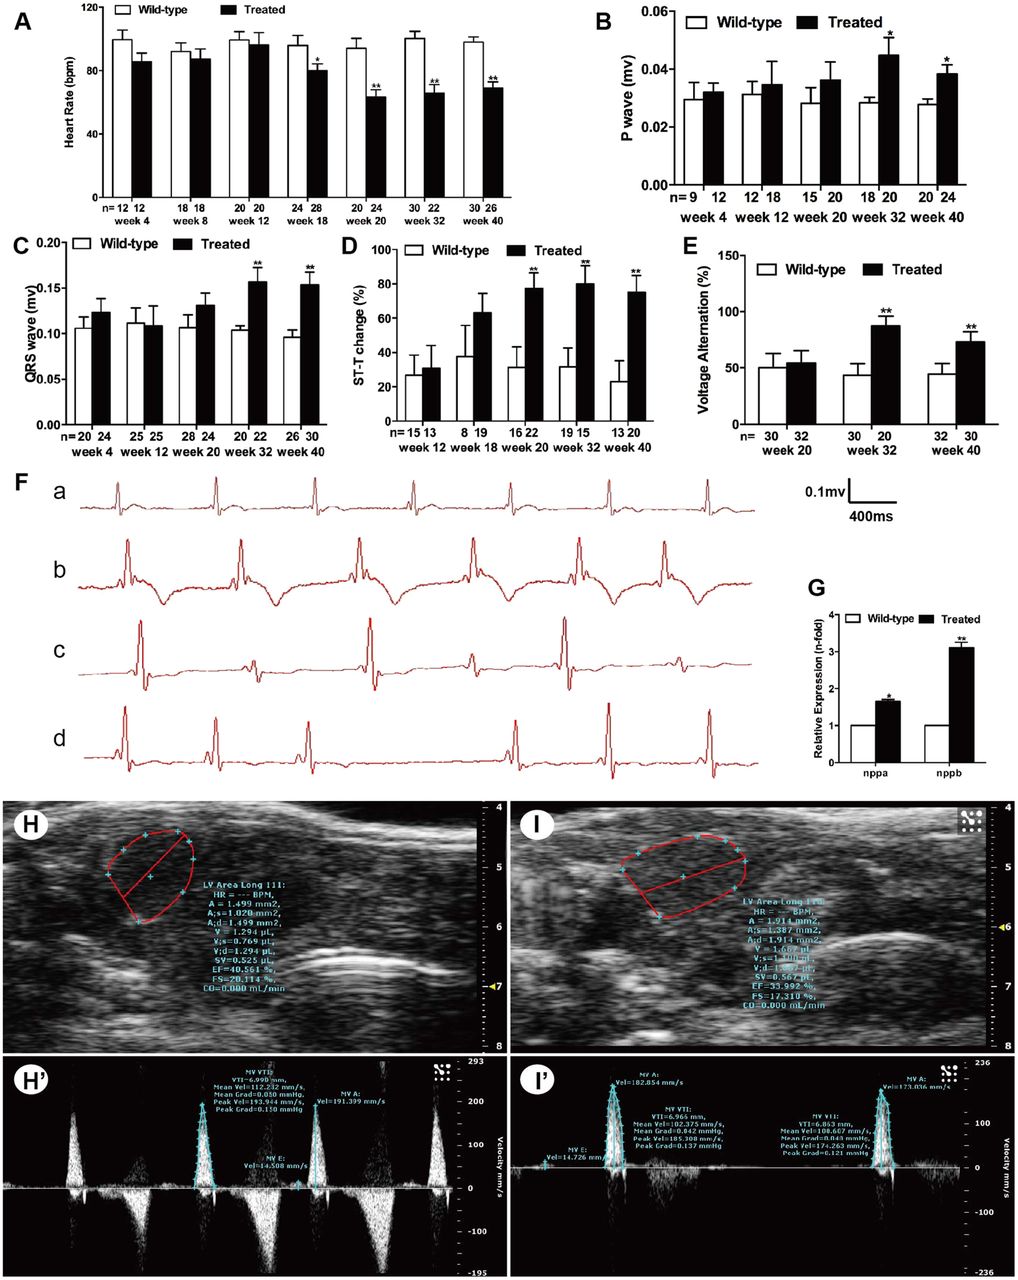
Fig. 4
Hyperglycemia induced cardiac dysfunction. (A) Analysis of heart rate (HR) at different time points. (B) Analysis of P-wave amplitude at different time points. (C) Analysis of QRS-wave amplitude at different time points. (D) Percentage of ST-T change (T-wave inversion or ST-T depression). (E) Percentage of voltage alteration. (F) Typical ECG diagrams: a, normal ECG; b, T-wave inversion; c, voltage alteration; and d, prolonged PP interval (sinus arrest). (G) Real-time PCR analysis of the expression of nppa and nppb in wild-type and treated zebrafish in week 32. (H,I) Typical B-mode echocardiography images of wild-type (H) and treated (I) fish to evaluate ventricular morphology and function (n=20 fish). (H′,I′) Doppler-derived images of atrioventricular (AV) valve velocity of the wild-type (H′) and treated (I′) fish (n=20 fish). (A–F) Values are reported as means±s.d. (H–I′) Image data were automatically generated using the Vevo 2100 Workstation Software package. *P<0.05, **P<0.01 compared with the wild-type group. n, number of fish examined.