
|
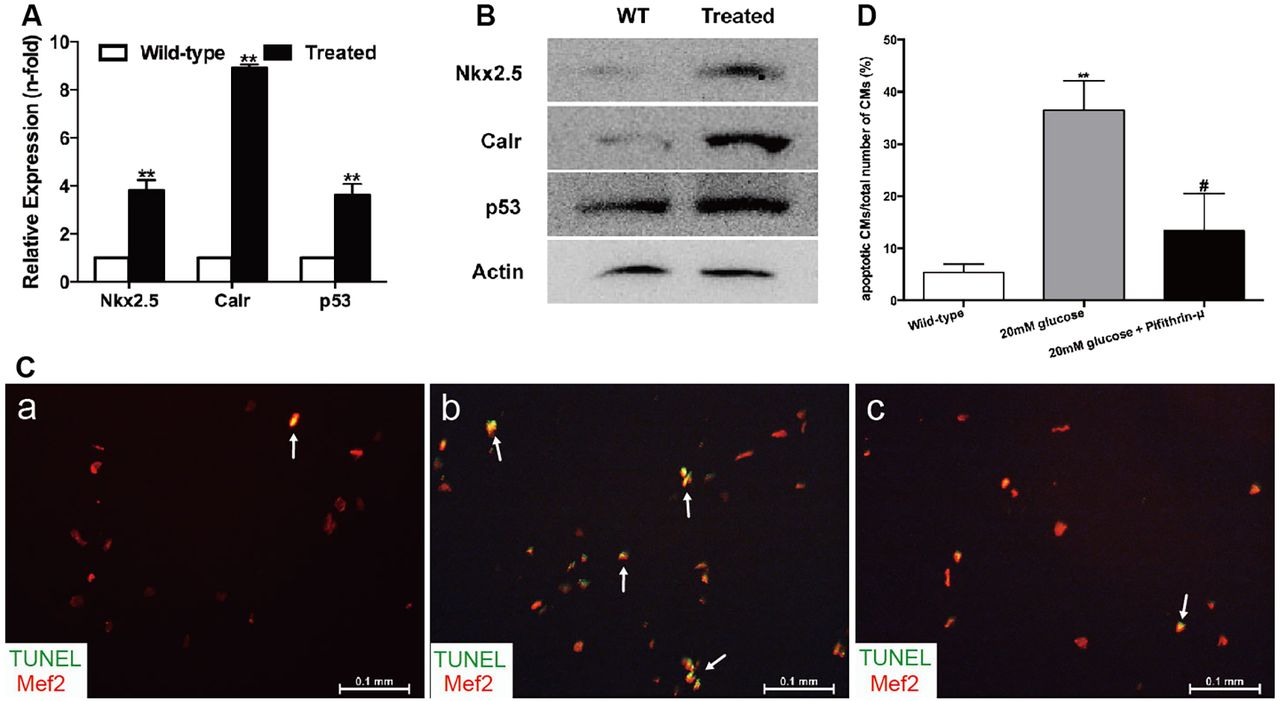
Fig. 5
High glucose levels induced alterations of the Nkx2.5–Calr–p53 signaling pathway and apoptosis. (A) Real-time PCR analysis of the expression of Nkx2.5, Calr and p53 in the wild-type and treated fish in week 32 (n=8 fish per group). (B) Western blot analysis of the expression of Nkx2.5, Calr and p53 in wild-type (WT) and treated fish in week 32 (n=8 fish, repeated three times). (C) Merged images of cardiomyocytes (CMs) co-stained with Mef2 (red) and TUNEL (green) in the wild-type group (a), CMs exposed to 20 mM glucose (b) and CMs exposed to 20 mM glucose together with 10 μM pifithrin-μ (c) (n=20 field, repeated five times). Arrows: TUNEL+/Mef2+ CMs. Scale bars: 0.1 mm. (D) Quantitation of apoptotic CMs to total number of CMs in vitro of the three groups: CMs without any treatment, with 20 mM glucose, or with 20 mM glucose plus 10 μM pifithrin-μ (n=20 field per group, repeated five times). (A,D) Bars represent means±s.e.m. **P<0.01 compared with the wild-type group. #P<0.05 compared with 20 mM glucose group.