
|
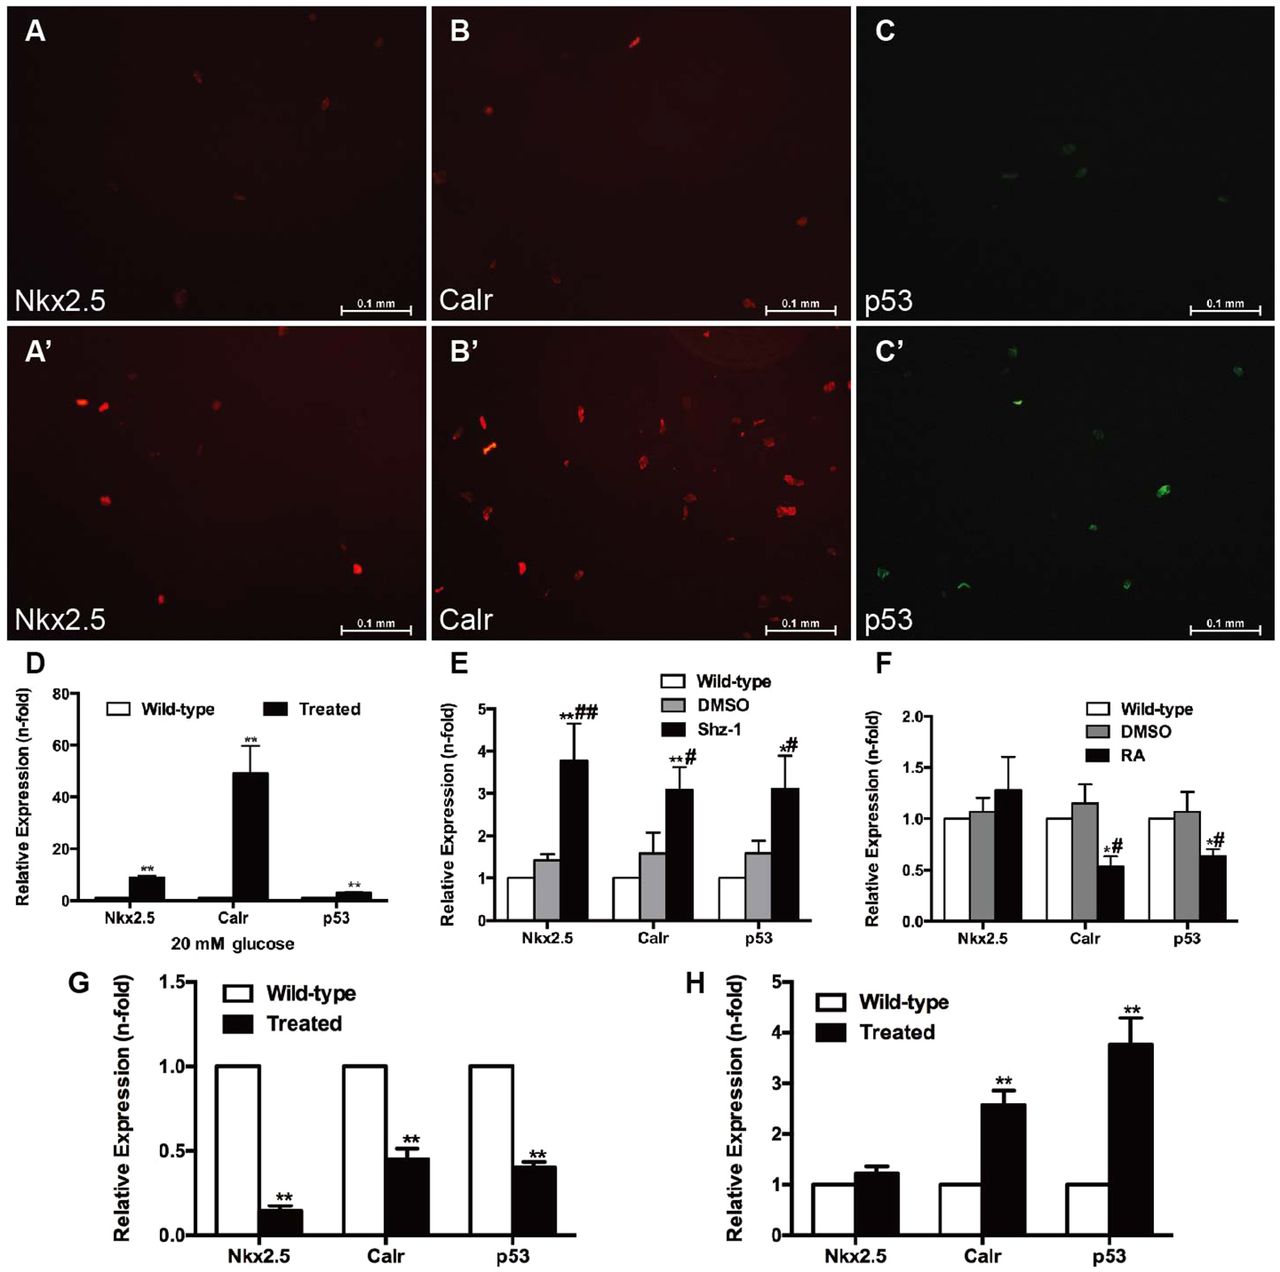
Fig. 6
Effects of high glucose, drugs and cell infection on cardiomyocytes. (A–D) Cardiomyocytes (CMs) were incubated with 20 mM glucose for 24 h before analysis. (A,A′) Anti-Nkx2.5 antibody staining showing increased Nkx2.5 levels in glucose-treated CMs (A′) compared with the wild-type group (A) (n=20 field, repeated five times); scale bars: 0.1 mm. (B,B′) Anti-Calr antibody staining showed increased Calr levels in glucose-treated CMs (B′) compared with the wild-type group (B) (n=20 field, repeated five times); scale bars: 0.1 mm. (C,C′) Anti-p53 antibody staining showed increased p53 levels in glucose-treated CMs (C′) compared with the wild-type group (C) (n=20 field, repeated five times); scale bars: 0.1 mm. (D) Expression levels of Nkx2.5, Calr and p53 determined by real-time PCR. (E) Real-time PCR analysis of Nkx2.5, Calr and p53 in CMs exposed to 2.5 μM Shz-1 compared with the wild-type fish and DMSO control. (F) Real-time PCR analysis of Nkx2.5, Calr and p53 in CMs exposed to 1 μM retinoic acid (RA) compared with the wild-type fish and DMSO control. (G) Changes in Calr and p53 levels in CMs with altered expression of Nkx2.5. (H) Upregulation of Calr expression increased p53 levels in CMs. (D–H) Bars represent means±s.e.m. (n=5–6 fish per group). *P<0.05, **P<0.01 compared with the wild-type group. #P<0.05, ##P<0.01 compared with the DMSO control (0.1%).