
- Title
-
Sensorimotor Representations in Cerebellar Granule Cells in Larval Zebrafish Are Dense, Spatially Organized, and Non-temporally Patterned
- Authors
- Knogler, L.D., Markov, D.A., Dragomir, E.I., Štih, V., Portugues, R.
- Source
- Full text @ Curr. Biol.

Characterization of the Larval Zebrafish Cerebellum and Its Granule Cell Population (A) Composite confocal stack showing the head of a 7-dpf transgenic larval zebrafish in bright-field expressing GCaMP6f pan-neuronally (in red) and mCherry in a large population of granule cells (in green). The scale bar represents 100 μm. (B) Schematic showing the anatomical lobes of the zebrafish cerebellum. CC, crista cerebellaris; CCe, corpus cerebella; EG, eminentia granularis; LCa, lobus caudalis cerebelli; Va, valvula cerebelli. The scale bar represents 100 μm. (C) Quantification of the number of granule cells labeled in each of the four transgenic zebrafish lines used in this study (n = 3, 6, 5, and 2 fish, respectively). Data are represented as mean ± SEM. (D) Example labeled granule cells from different regions of the cerebellum with zero, one, two, three, or four dendritic claws. Open arrowheads indicate dendritic claws, black arrowheads indicate dendritic branches without claws, pound indicates putative growth cone, and the truncated parallel fiber axons for all cells are marked with asterisks. The scale bar represents 10 μm. See Figure S1 for additional morphology of granule cells. See also Figure S1. |

Representations in Granule Cells Are Non-sparse (A) Stimulus paradigm presented to the larvae. Whole-field flashes were of 50, 100, 200, 500, 1,000, and 3,000 ms durations. Moving gratings were presented for 5 s at three caudo-rostral speeds (3, 10, and 30 mm/s) and one rostro-caudal speed (−10 mm/s). Average luminance across whole-field gratings was half as bright as the red flashes but brighter than the background luminance (shown here as dark gray). A mild (2 mA) electric shock lasting 10–25 ms was also delivered. These stimuli were presented in a randomized order in the experiments but are reshuffled to this order in later panels. (B) Top: anatomical image of one imaging plane through the granule cell layer (scale bar, 50 μm). Bottom: heatmap of the maximum df/f signal (as a percent) for all anatomically segmented neurons in this plane shows dense activation of these neurons. See Figure S2 for anatomical segmentation. (C) All of the granule cells extracted from two subsequent imaging planes (1 μm apart). In most cases, the same granule cell could be imaged in multiple planes. (D) Upper trace: example average granule cell response to the stimuli presented with SD (shaded region). Lower traces: z scored activity traces from this same cell collected across multiple planes. (E) All 252 granule cell responses appearing in plane n+1 from (C) were clustered using k means into seven response types, and the reorganized correlation matrix is shown. Most granule cells exhibit some stimulus-locked response as evidenced by the high degree of structure in the correlation matrix. (F) Histogram showing the mean (across 16 fish) cumulative distribution of maximum df/f for all (not just active) granule cells. The shaded region denotes the SE. On average, over 50% of granule cells had a maximum df/f above 150%. (G) Left: pseudocolored image of a single plane of parallel fibers from the right cerebellar hemisphere showing the difference between fluorescence during a particular stimulus frame and the average fluorescence. Blue, forward moving fast gratings; red, 3 s flash stimulus; yellow, shock stimulus. The scale bar represents 25 μm. Insets show higher magnification of regions of interest (ROIs) containing putative presynaptic puncta from parallel fibers (position indicated by the boxes at left) responsive to different stimuli. The scale bar represents 5 μm. Right: the activity traces from these circled ROIs at left show responses that match with the activity seen in granule cell somata (e.g., compare lower blue trace to trace in D). See also Figure S2 and Movies S1, S2, and S3. |
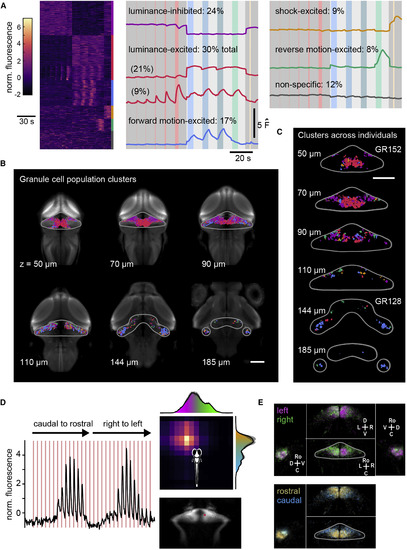
Granule Cells across the Cerebellum Are Organized Topographically with Respect to Stimulus Response Profile and Visual Receptive Field (A) Left: heatmap of z scored activity of all 12,283 granule cells (n = 16 fish) sorted into seven clusters by k means clustering. Despite GCaMP6S and GCaMP6F signals having different kinetics, granule cells with similar response profiles nonetheless cluster together. Right: the average activity trace from each cluster is shown at the right and labeled according to stimulus response type and what percentage of granule cells belong to that cluster. Note that two clusters appear to be “luminance-excited”: these are grouped together in subsequent panels. See Figure S3 for example activity traces from individual cells (calcium imaging and electrophysiology) and anatomical organization of luminance-excited subclusters. (B) Single planes at different depths from the surface of the brain showing the most likely response profile to be found in the granule cell soma layer when fish across all experiments (n = 24) are combined, together with pan-neuronal expression for anatomical reference. Colors are coded for response profile as in (A). The gray outline shows the approximate boundaries of the cerebellum for reference. The scale bar represents 100 μm. (C) Same as for (B), showing example planes from individual fish from different transgenic lines. (D) To investigate retinotopy, the visual field was divided into 15 horizontal and vertical bars that were flashed for 1 s (red shading). For every neuron (average for one sample neuron across planes shown in black), this allowed us to estimate the receptive field (color coded on the top right for the same neuron). The location of the sample neuron is shown on the bottom right. The histograms showing the probability distribution of the location of the centroid of all receptive fields are shown (left-right location in magenta-purple and rostro-caudal location in orange to cyan) (average across six fish with a total of 2,603 granule cells; the shaded region indicates the SE). The scale is the same as for (B). (E) Granule cells have been color coded according to the centroid of their visual receptive field using the same color code as in (D). Top: lateralization of receptive fields. The outlined cerebellum is shown for reference over the bird’s eye view. Additional sagittal and coronal views are indicated by the axes (C, caudal; D, dorsal; L, lateral; M, medial; Ro, rostral; V, ventral). Bottom: the same views as in the top panel, but showing rostro-caudal receptive fields. The scale is the same as for (D). See also Figures S3 and S4. |

Granule Cells Can Encode Purely Sensory or Motor Information as well as Multimodal Sensorimotor Combinations (A) Typical behavior evoked by our stimuli in head-embedded imaging experiments with the tail freed from the agarose. Only forward-moving gratings and the mild electric shock elicit behavior. n = 5. (B) Green trace is the convolved regressor of motor activity, black traces are the simultaneously acquired z scored fluorescence traces for the two granule cells shown in (A), and blue trace is the convolved regressor for forward-moving stimuli. Correlation coefficients between the activity of each cell and its best regressor are shown. (C) Two example activity profiles of simultaneously recorded granule cells from behaving fish excited by moving forward gratings that were distinguished as having motor-related (upper trace) or sensory-related (lower trace) activity. (D) (i) Maximum projection of 212 granule cells that could be classified as sensory (forward motion or shock) or motor from behaving fish (n = 5). Pan-neuronal reference anatomy and an outline of the approximate boundary of the cerebellum are shown in gray. (ii) Single planes at different depths from the stack showing the dorsal-ventral distribution of response types. The scale bars represent 100 μm. (E) Three example cells showing multimodal responses to (i) sensory shock and motor activity, (ii) sensory forward motion and motor activity, and (iii) sensory reverse motion and motor activity. (F) (i) Activity from individual planes of the granule cells in (E) are concatenated and correlated with regressors for the most relevant sensory stimulus and the convolved simultaneous motor activity of the fish. Yellow trace is the convolved regressor for shock stimuli, black trace is the z scored fluorescence for the cell in (Ei) across seven planes, and gray trace is the convolved vigor regressor of behavior from these planes. The sensory regressor also appears in the middle trace as a shaded area that highlights the correlation of the granule cell activity with sensory stimuli. Open arrowheads highlight peaks that correlate with motor activity, but not sensory stimuli. Corresponding correlation coefficients of granule cell activity with the regressors are indicated. (ii and iii) The same as for (i) is shown, instead showing the activity of cells from (Eii) and (Eiii). |

Changes in Granule Cell Representations Correlate with a Behavioral Change in Sensitivity to Sensory Stimuli (A) Upper-left trace: probability of a behavioral response to visual stimuli in the ten trials immediately following injection of 10 mM bicuculline, a GABAA receptor antagonist, into the cerebellum (n = 11). The average behavior is shown with shaded SE. Note that no electrical stimulus was presented in this subset of experiments. Lower-left trace: behavioral responses in these same animals recover as bicuculline washes out. Lower-right trace: sham injections into the cerebellum failed to elicit any increase in luminance-evoked behavior. Upper right: example epifluorescence micrographs showing the extent of the bicuculline (with rhodamine) injections. The scale bar represents 100 μm. The shaded region in behavioral traces indicates the SE. (B) Heatmaps from the same imaging plane through the granule cell layer in a 7-dpf GR152:gal4; UAS:GCaMP6s fish showing the change in pixelwise correlations to luminance (upper) and motor (lower) regressors following the addition of bicuculline. The scale bar represents 50 μm. Colored circles indicate example granule cells analyzed in subsequent panels. (C) Heatmaps of activity from (i) two example granule cells that change their responses following the addition of bicuculline. The upper cell, gc 1, becomes less responsive to luminance and more responsive to motor activity, whereas the bottom cell, gc 2, becomes newly responsive to luminance and motor activity. Location of granule cells is shown in (B). (ii) Heatmap showing the behavioral responses over the experiment. (D) The plotted change in regressor over trials for the two example granule cells, color coded for the two example cells as in (Ci). The gray bar indicates the presence of 30 μm bicuculline. |

Detailed morphology of individual granule cells and transgenic populations. Related to Figure 1. Ai-v) Example additional dendritic morphologies of twenty granule cells are grouped by somata location and axonal projection (refer to Figure 1 for information on abbreviated anatomical regions). Truncated parallel fibers in the detailed morphology are indicated by asterisks. Scale bar = 10 microns. The traced parallel fiber projections (shown in black) for these cells and others with somata in the same region are morphed to a common reference anatomy (shown in grey). Scale bar = 100 microns for the parallel fiber overviews. B) Z-projections of confocal stacks from transgenic lines labeling the granule cells used in our experiments. Morphologies were obtained from (clockwise, starting at upper left) N= 6, 5, 3, and 2 fish. Scale bar = 100 microns. C) Dendritic morphology of two granule cells in the CCe at three developmental time points showing the stability of dendritic claw number and overall morphology. Scale bar = 10 microns. D) Tilted view showing pan-neuronal GCaMP6f in the zebrafish brain in grey (the moon-shaped optic tecta are very salient). The cerebellum has a stereotypical tri-layered configuration where the granule cell layer (green) sends parallel fibers to the molecular layer, where they contact the dendrites of the Purkinje cells (magenta). Inferior olivary neurons (red) also provide inputs to the Purkinje cells. Scale bar = 100 microns. E) Composite whole-field image from a cell-attached electrophysiological recording of a granule cell. A large granule cell population is labelled by GR90:gal4;UAS:GFP (in green), the pipette (with intracellular solution containing sulforhodamine dye) is labelled in magenta, and the bright-field anatomy is shown in grey. Scale bar = 20 microns. F) Whole-brain imaging of fish expressing GCaMP6s in granule cells provided datasets such as the one shown here that can be easily segmented functionally by using local fluorescence correlations. All the significantly active voxels for one experiment are shown here at three different roll angles: 0 degrees (from above) showing parallel fibers, 30 degrees and 180 degrees (from below) showing granule cell somata (see also Movie S1). Scale same as for (B). |

Automated segmentation of granule cell somata from whole-brain imaging data. Related to Figure 2. A) Anatomical image of one imaging plane through the granule cell layer. B) Same plane with automated anatomical segmentation of granule cell somata indicated by red circles. In this plane, 252 cells were segmented. Scale bar = 50 microns. |

Detailed examination of response profiles within a cluster. Related to Figure 3. A) The average response profile is shown for the seven granule cell clusters labelled as for Figure 3A. B) Each column shows the z-scored activity traces from one hundred randomly selected cells belonging to the cluster shown in (A). C) Left, based on their shared functional increase in activity when luminance increases, we group the two clusters of luminance-excited cells together in this study. Right, anatomical clustering of these two profiles separately (equivalent to the combined red cluster in Figure 3B) shows differences in location, with the smaller, magenta cluster more medially-located. |

Granule cells show stereotyped temporal responses within a stimulus modality. Related to Figure 3 and Figure 6. A) Upper panel, cell-attached electrophysiological recordings from a luminance-excited granule cell showing its response to stimuli over five repeated trials. A 500 ms period following the shock stimulus is blanked to remove the stimulus artifact. Lower panel, average firing rate of this granule cell across all trials. B) Same as for (A), instead showing an example luminance-inhibited cell. C) The relationship between burst frequency and grating speed in all luminance-responsive cells shows that these bursts depend on the frequency of the moving bars and not their direction of motion (n=9 luminance-excited; n=6 luminance-inhibited). D) Left, cells with luminance-excited responses saturate both their average and maximum firing rate with increasing stimulus duration beyond 200-500 ms. Right, cells with luminance inhibited responses show a saturating decrease in average firing rate with increasing stimulus duration beyond 200ms however rebound excitation following inhibition increases linearly with longer durations. Data are represented as mean ± SEM and are fit with least-squares nonlinear curves or a straight line as appropriate. E) granule cell locations from all electrophysiological recordings mapped onto the reference anatomy and color-coded according to response profile (see Figure 3 for details). Scale bar is 100 microns. F) Same as for (A), instead showing an example forward motion-excited cell. G) Averaged population firing rate and H) Speed tuning curves for all electrophysiological recordings from motion selective cells (n=5). Mean ± SEM across all fish is displayed in color. i) Same as for (A), instead showing an example shock-excited cell. J) Average firing rate in response to the shock stimulus from all cell-attached recordings of shock-excited granule cells (n=6). The population average is shown in black and appears to have multiple peaks due to the variability in the timing of an individual cell's response, which may reflect experimental variability in the placement of the electrodes relative to the cell being recorded. K) The first spike following preferred stimulus onset occurs with an average latency of several hundred milliseconds for luminance- and shock-responses, but with a much longer latency for cells that respond to forward motion. Grey center lines show the means; box limits indicate the 25th and 75th percentiles; whiskers extend 1.5 times the interquartile range from the 25th and 75th percentiles; data points are plotted as open circles. n = 9, 6, 5, 6 sample points. L) The mean baseline firing rate and firing rate of each cell within its category of preferred stimulus is plotted from cell-attached electrophysiological recordings (preferred stimulus indicated in each subplot). Mean ± SEM across groups are plotted in the panel at the right. |