
|
Fig. 3
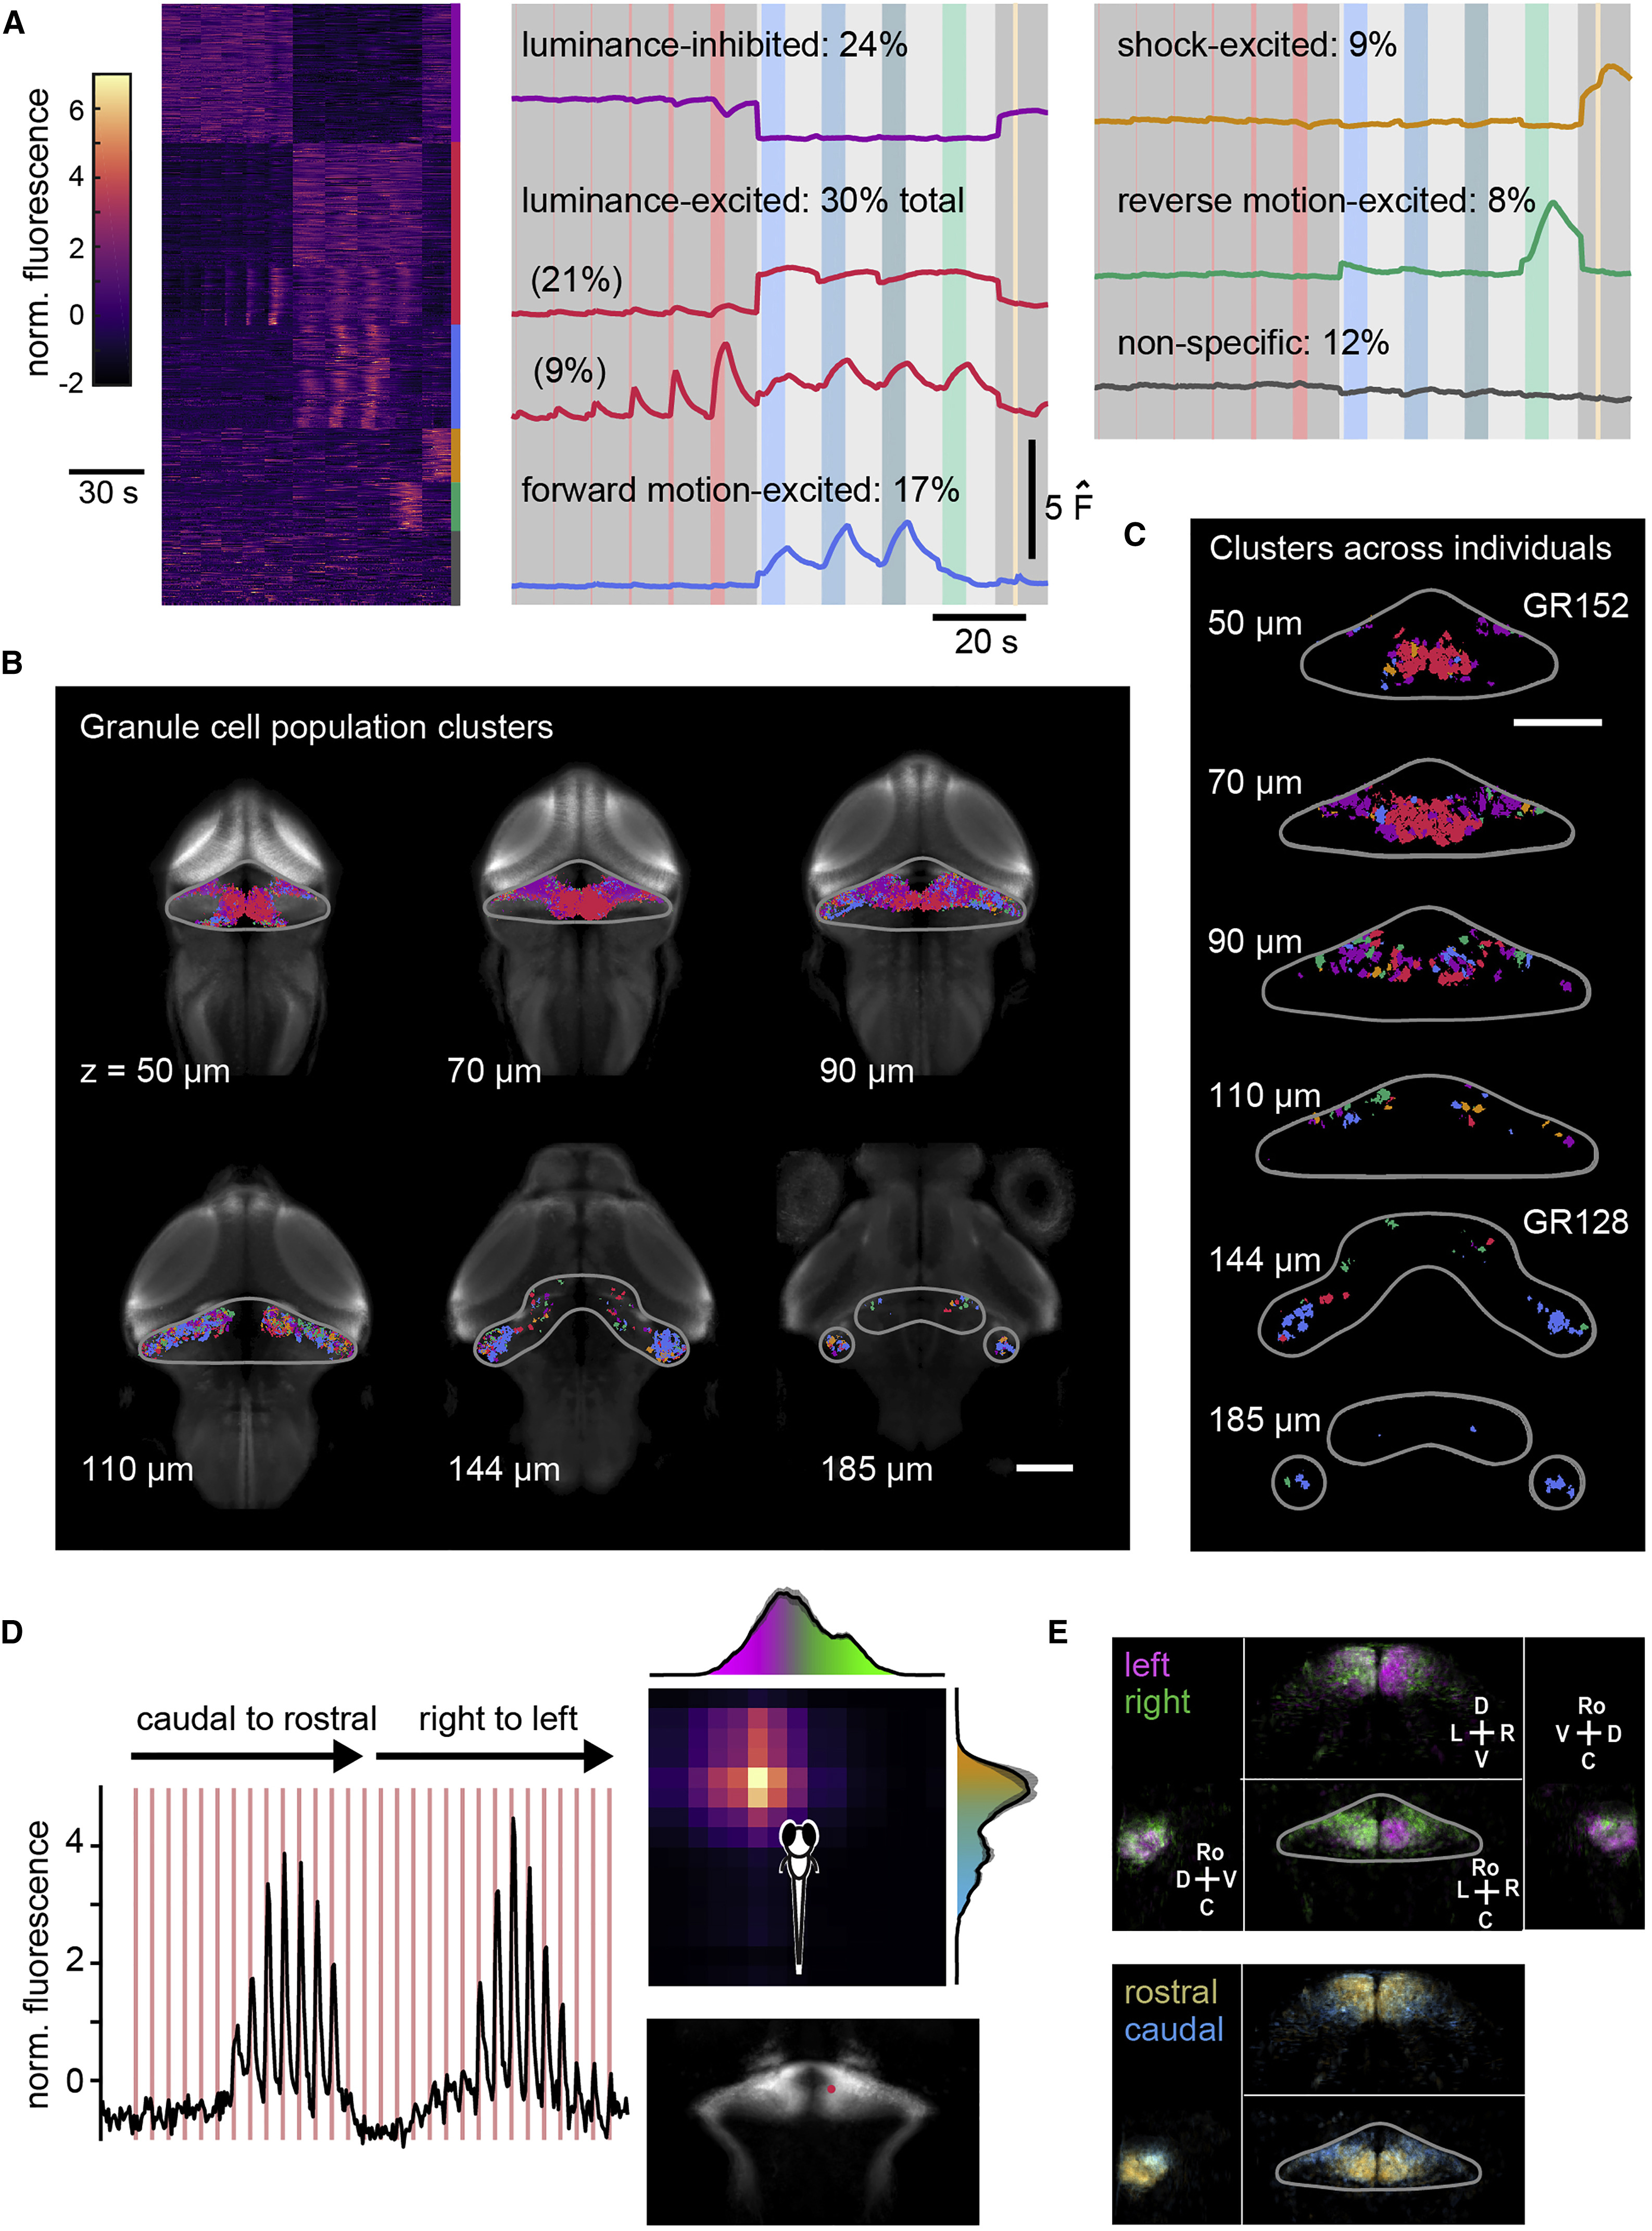
Granule Cells across the Cerebellum Are Organized Topographically with Respect to Stimulus Response Profile and Visual Receptive Field
(A) Left: heatmap of z scored activity of all 12,283 granule cells (n = 16 fish) sorted into seven clusters by k means clustering. Despite GCaMP6S and GCaMP6F signals having different kinetics, granule cells with similar response profiles nonetheless cluster together. Right: the average activity trace from each cluster is shown at the right and labeled according to stimulus response type and what percentage of granule cells belong to that cluster. Note that two clusters appear to be “luminance-excited”: these are grouped together in subsequent panels. See Figure S3 for example activity traces from individual cells (calcium imaging and electrophysiology) and anatomical organization of luminance-excited subclusters.
(B) Single planes at different depths from the surface of the brain showing the most likely response profile to be found in the granule cell soma layer when fish across all experiments (n = 24) are combined, together with pan-neuronal expression for anatomical reference. Colors are coded for response profile as in (A). The gray outline shows the approximate boundaries of the cerebellum for reference. The scale bar represents 100 μm.
(C) Same as for (B), showing example planes from individual fish from different transgenic lines.
(D) To investigate retinotopy, the visual field was divided into 15 horizontal and vertical bars that were flashed for 1 s (red shading). For every neuron (average for one sample neuron across planes shown in black), this allowed us to estimate the receptive field (color coded on the top right for the same neuron). The location of the sample neuron is shown on the bottom right. The histograms showing the probability distribution of the location of the centroid of all receptive fields are shown (left-right location in magenta-purple and rostro-caudal location in orange to cyan) (average across six fish with a total of 2,603 granule cells; the shaded region indicates the SE). The scale is the same as for (B).
(E) Granule cells have been color coded according to the centroid of their visual receptive field using the same color code as in (D). Top: lateralization of receptive fields. The outlined cerebellum is shown for reference over the bird’s eye view. Additional sagittal and coronal views are indicated by the axes (C, caudal; D, dorsal; L, lateral; M, medial; Ro, rostral; V, ventral). Bottom: the same views as in the top panel, but showing rostro-caudal receptive fields. The scale is the same as for (D).
See also Figures S3 and S4.