
|
Fig. 2
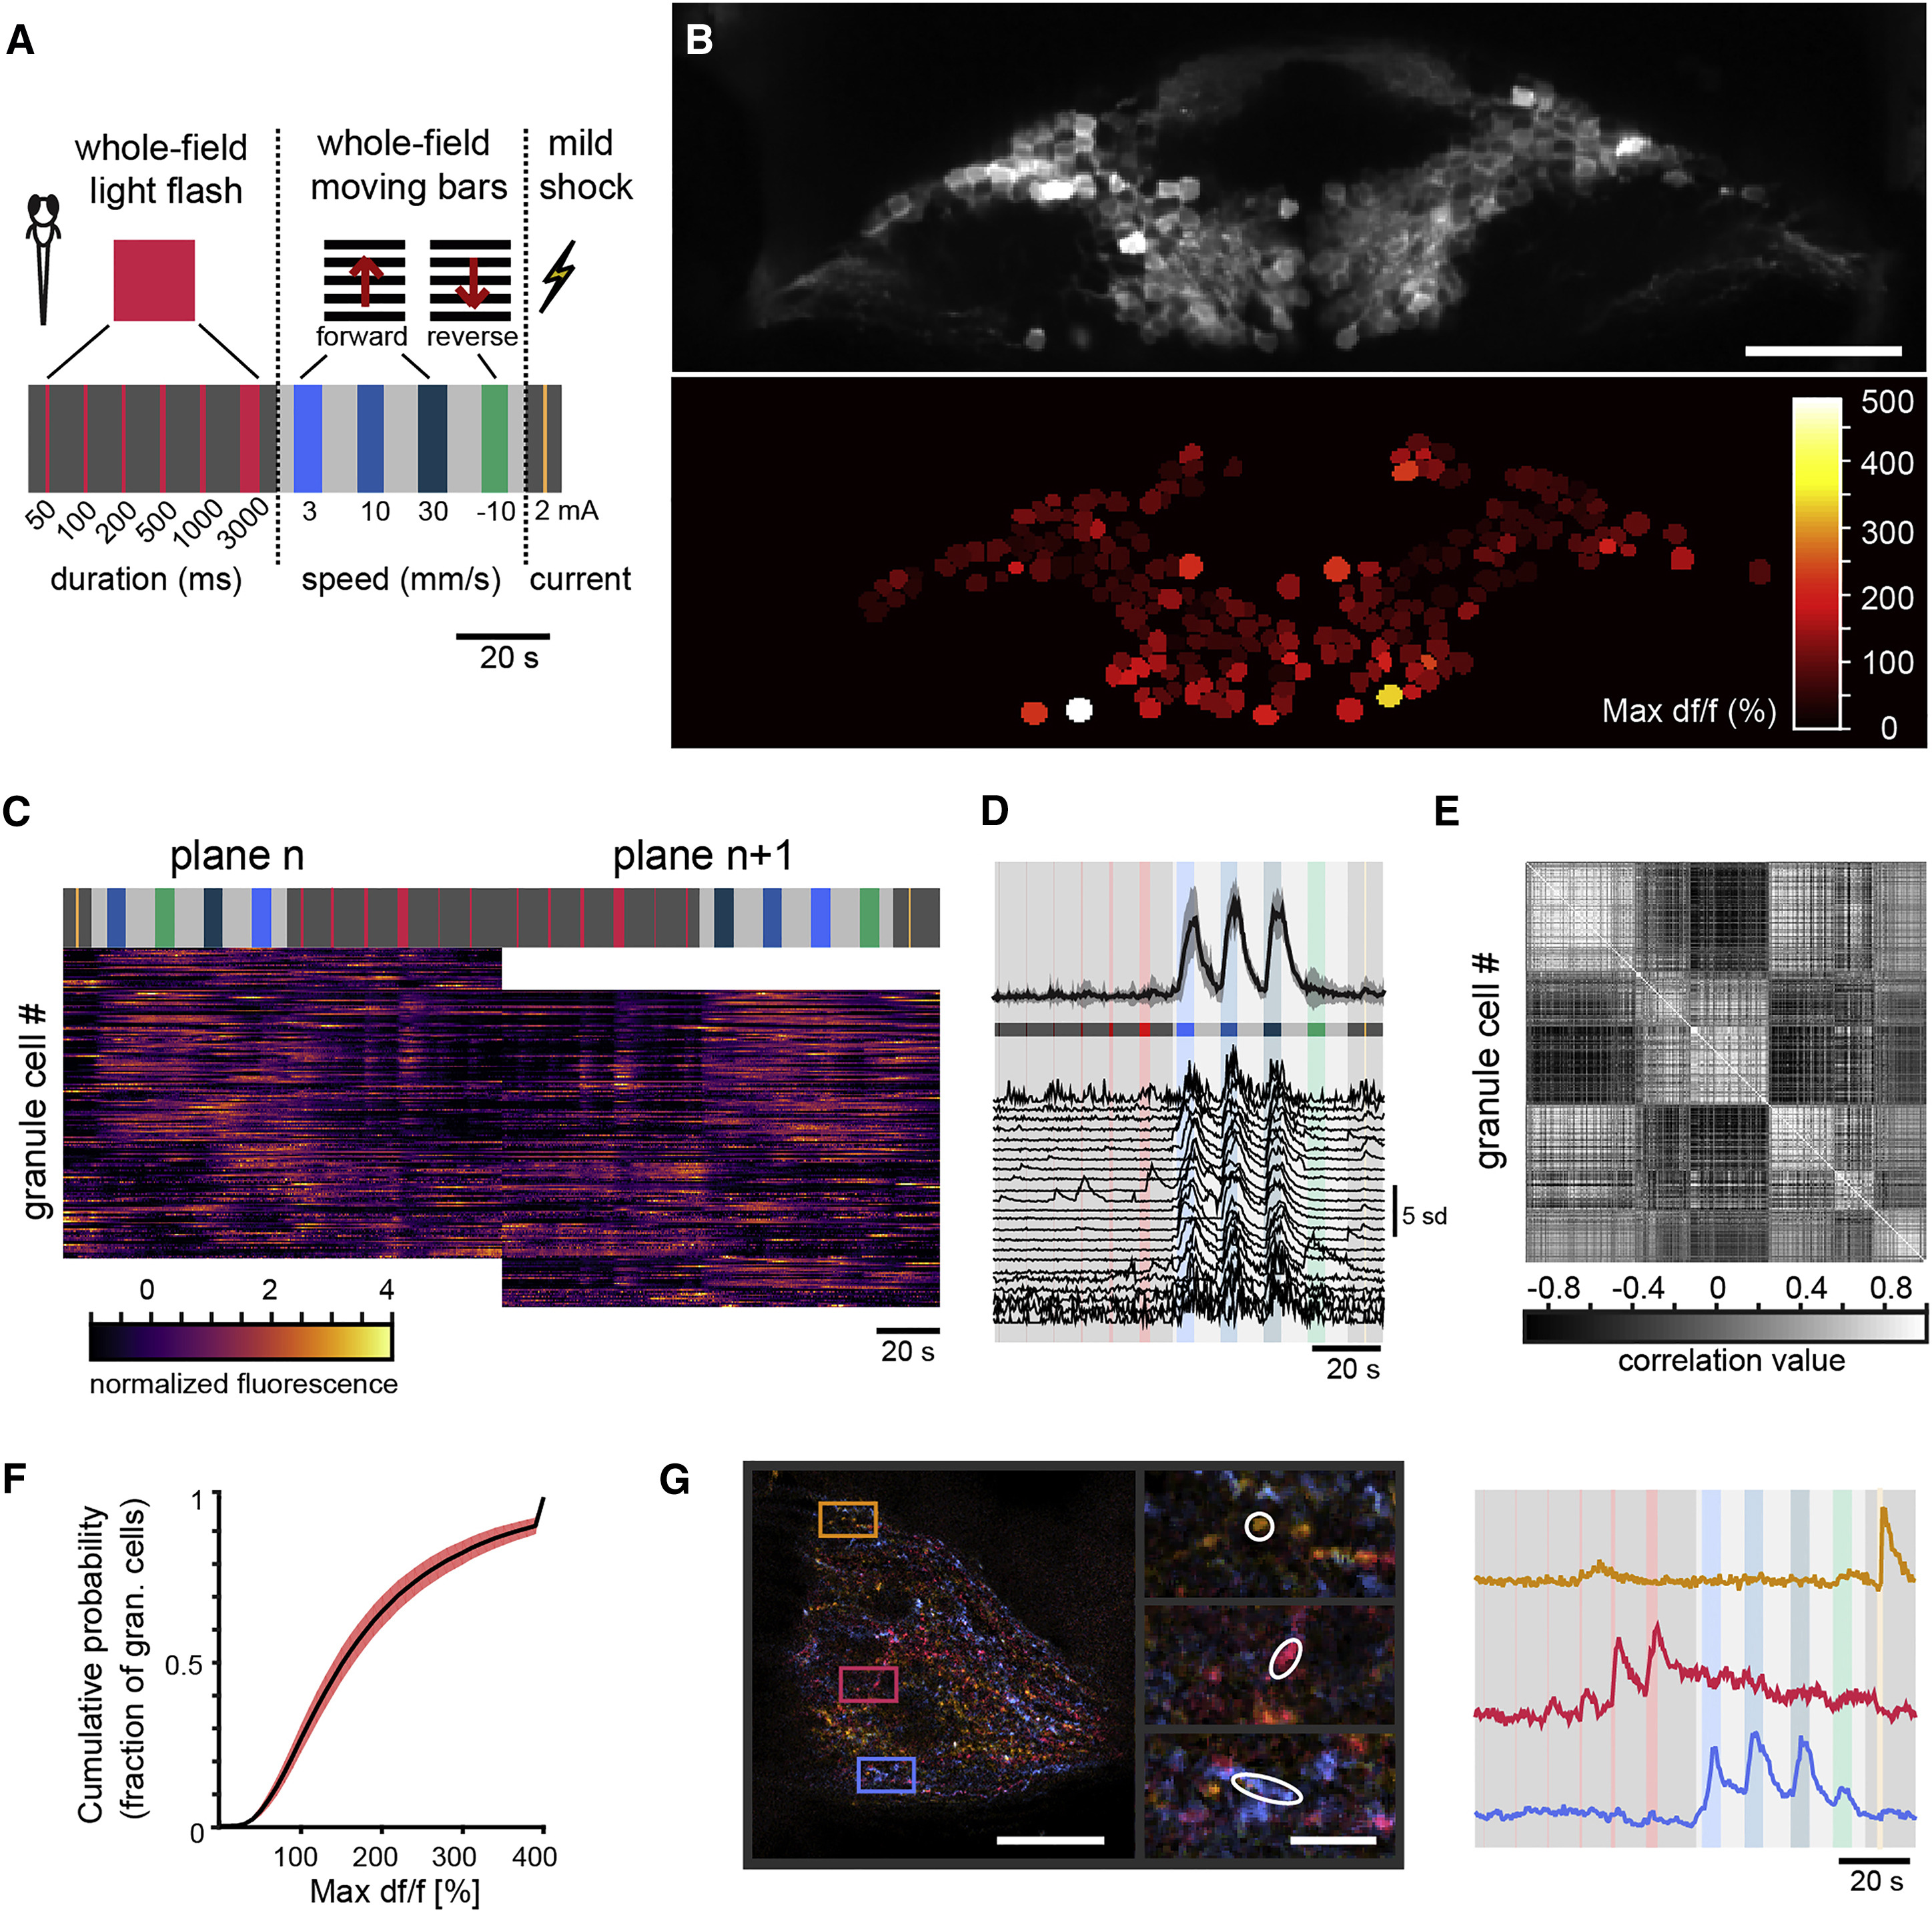
Representations in Granule Cells Are Non-sparse
(A) Stimulus paradigm presented to the larvae. Whole-field flashes were of 50, 100, 200, 500, 1,000, and 3,000 ms durations. Moving gratings were presented for 5 s at three caudo-rostral speeds (3, 10, and 30 mm/s) and one rostro-caudal speed (−10 mm/s). Average luminance across whole-field gratings was half as bright as the red flashes but brighter than the background luminance (shown here as dark gray). A mild (2 mA) electric shock lasting 10–25 ms was also delivered. These stimuli were presented in a randomized order in the experiments but are reshuffled to this order in later panels.
(B) Top: anatomical image of one imaging plane through the granule cell layer (scale bar, 50 μm). Bottom: heatmap of the maximum df/f signal (as a percent) for all anatomically segmented neurons in this plane shows dense activation of these neurons. See Figure S2 for anatomical segmentation.
(C) All of the granule cells extracted from two subsequent imaging planes (1 μm apart). In most cases, the same granule cell could be imaged in multiple planes.
(D) Upper trace: example average granule cell response to the stimuli presented with SD (shaded region). Lower traces: z scored activity traces from this same cell collected across multiple planes.
(E) All 252 granule cell responses appearing in plane n+1 from (C) were clustered using k means into seven response types, and the reorganized correlation matrix is shown. Most granule cells exhibit some stimulus-locked response as evidenced by the high degree of structure in the correlation matrix.
(F) Histogram showing the mean (across 16 fish) cumulative distribution of maximum df/f for all (not just active) granule cells. The shaded region denotes the SE. On average, over 50% of granule cells had a maximum df/f above 150%.
(G) Left: pseudocolored image of a single plane of parallel fibers from the right cerebellar hemisphere showing the difference between fluorescence during a particular stimulus frame and the average fluorescence. Blue, forward moving fast gratings; red, 3 s flash stimulus; yellow, shock stimulus. The scale bar represents 25 μm. Insets show higher magnification of regions of interest (ROIs) containing putative presynaptic puncta from parallel fibers (position indicated by the boxes at left) responsive to different stimuli. The scale bar represents 5 μm. Right: the activity traces from these circled ROIs at left show responses that match with the activity seen in granule cell somata (e.g., compare lower blue trace to trace in D).
See also Figure S2 and Movies S1, S2, and S3.