
|
Fig. 4
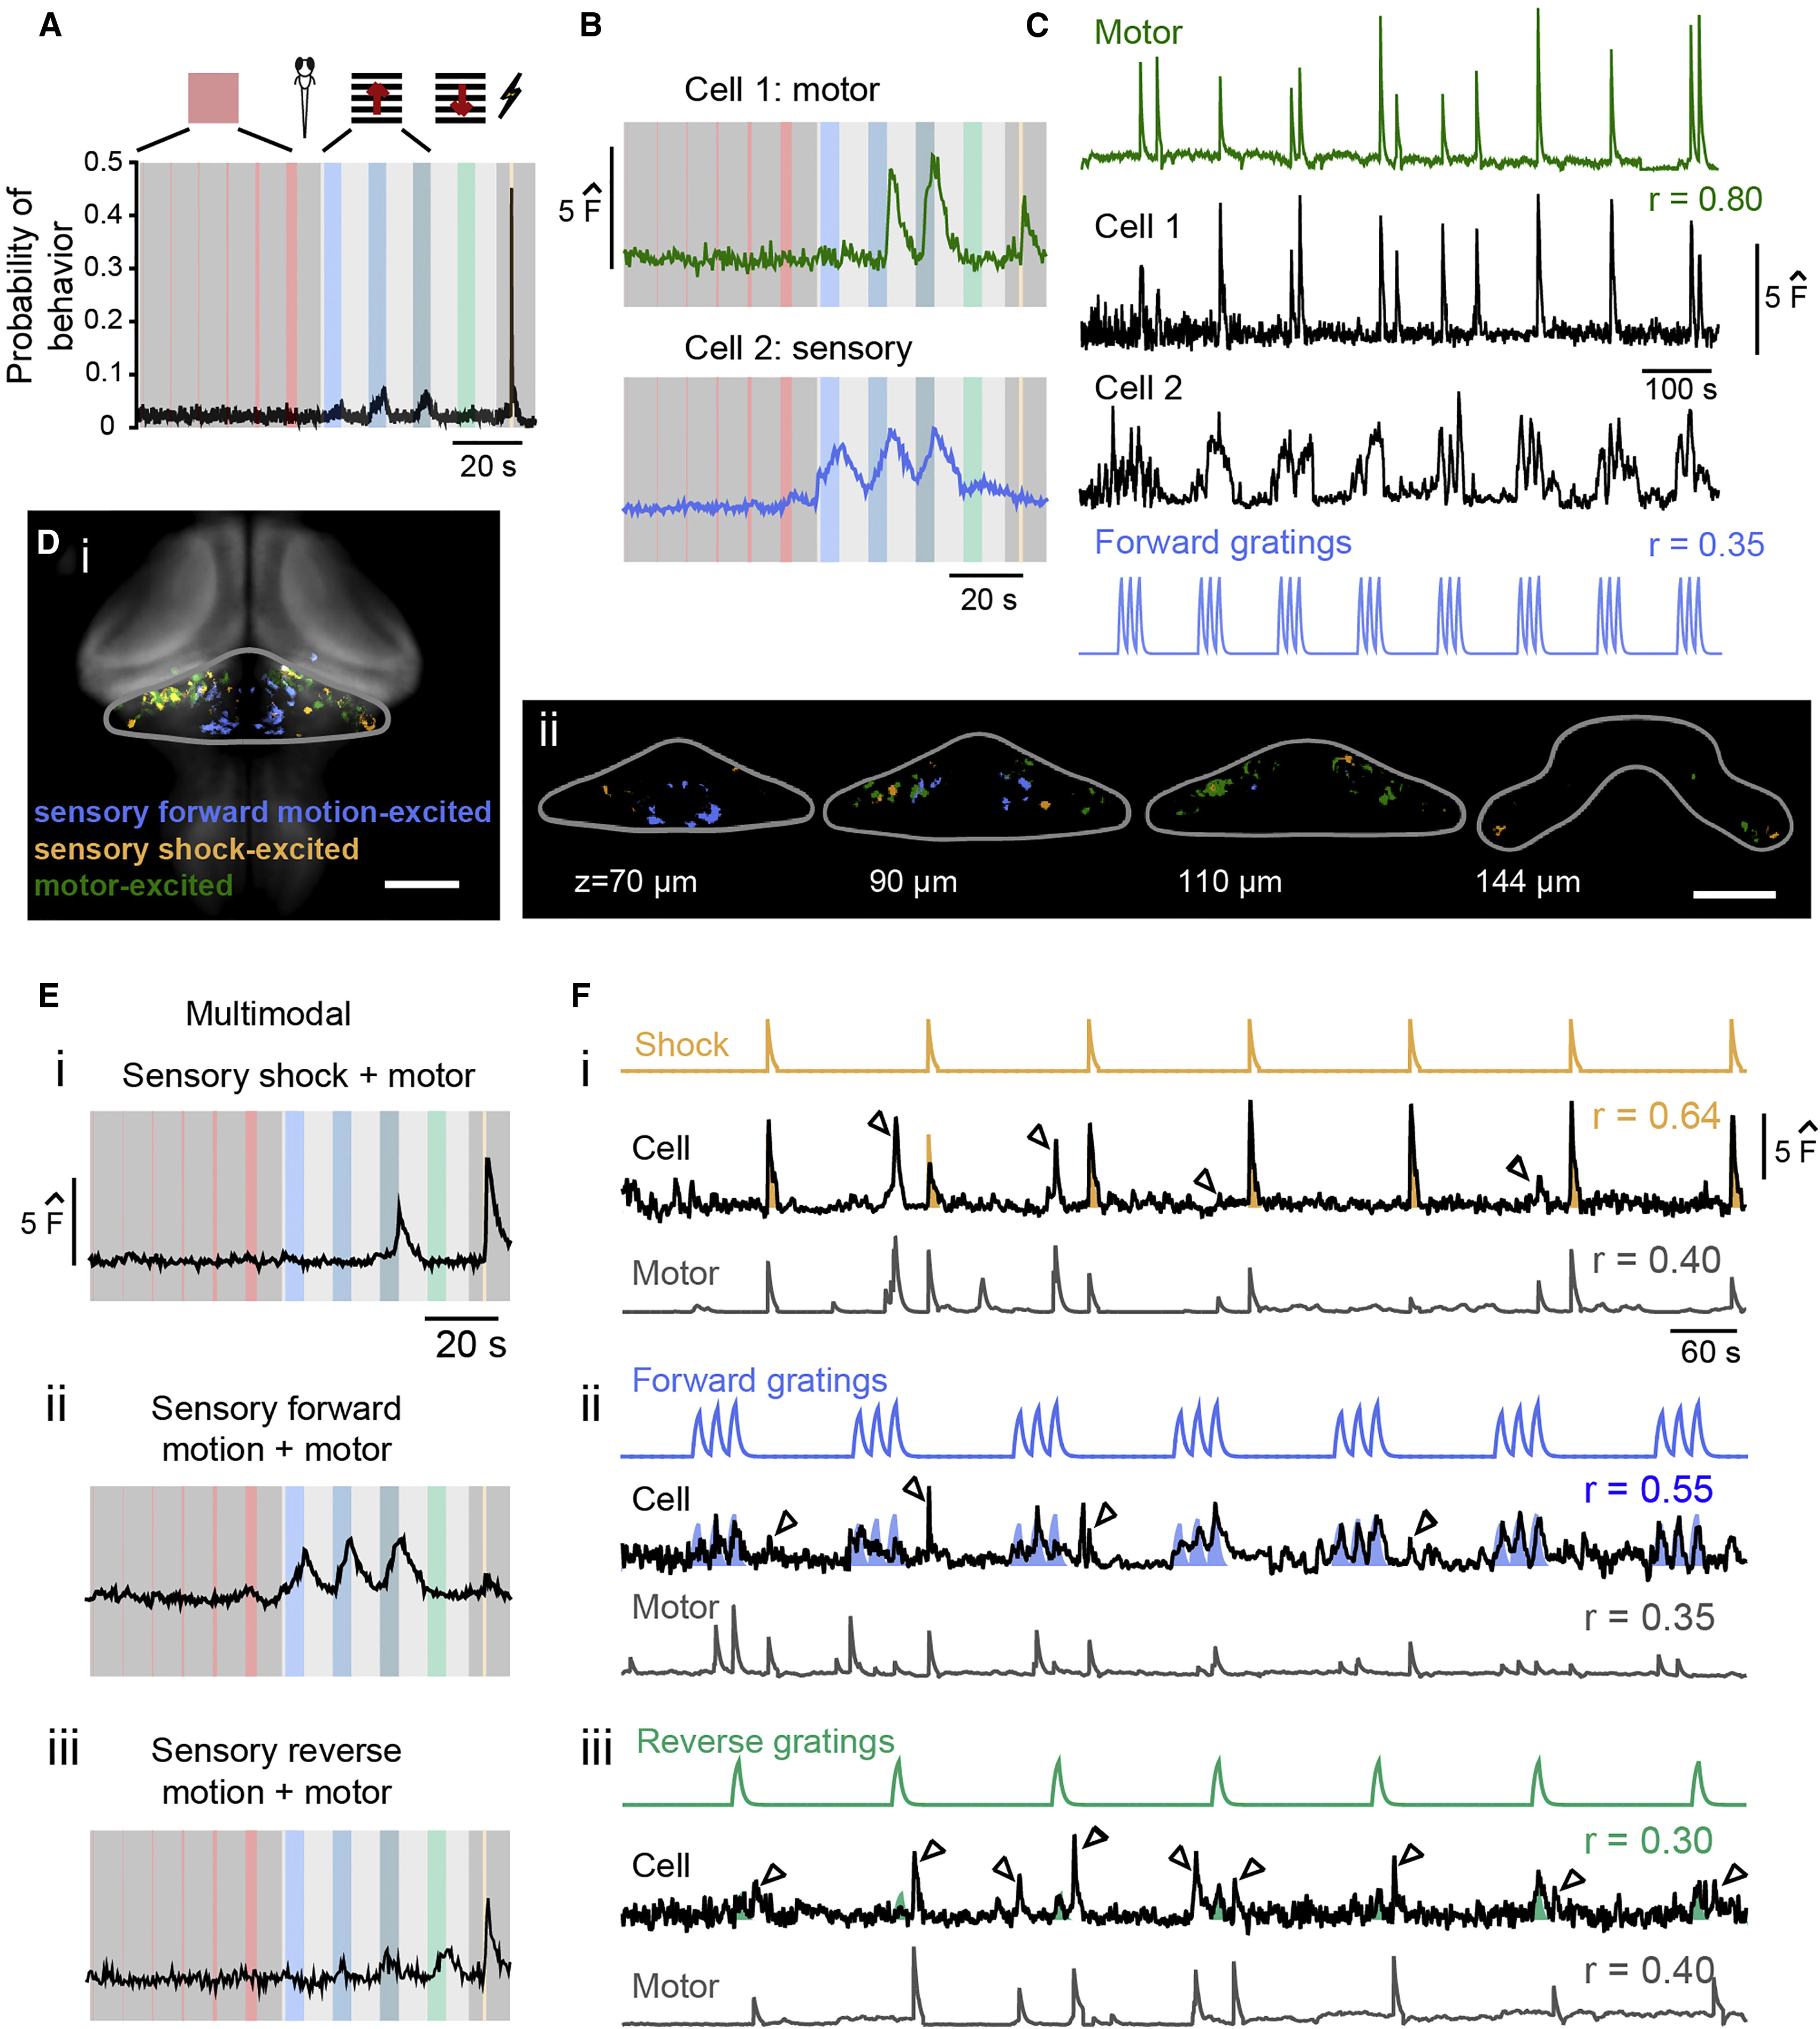
Granule Cells Can Encode Purely Sensory or Motor Information as well as Multimodal Sensorimotor Combinations
(A) Typical behavior evoked by our stimuli in head-embedded imaging experiments with the tail freed from the agarose. Only forward-moving gratings and the mild electric shock elicit behavior. n = 5.
(B) Green trace is the convolved regressor of motor activity, black traces are the simultaneously acquired z scored fluorescence traces for the two granule cells shown in (A), and blue trace is the convolved regressor for forward-moving stimuli. Correlation coefficients between the activity of each cell and its best regressor are shown.
(C) Two example activity profiles of simultaneously recorded granule cells from behaving fish excited by moving forward gratings that were distinguished as having motor-related (upper trace) or sensory-related (lower trace) activity.
(D) (i) Maximum projection of 212 granule cells that could be classified as sensory (forward motion or shock) or motor from behaving fish (n = 5). Pan-neuronal reference anatomy and an outline of the approximate boundary of the cerebellum are shown in gray. (ii) Single planes at different depths from the stack showing the dorsal-ventral distribution of response types. The scale bars represent 100 μm.
(E) Three example cells showing multimodal responses to (i) sensory shock and motor activity, (ii) sensory forward motion and motor activity, and (iii) sensory reverse motion and motor activity.
(F) (i) Activity from individual planes of the granule cells in (E) are concatenated and correlated with regressors for the most relevant sensory stimulus and the convolved simultaneous motor activity of the fish. Yellow trace is the convolved regressor for shock stimuli, black trace is the z scored fluorescence for the cell in (Ei) across seven planes, and gray trace is the convolved vigor regressor of behavior from these planes. The sensory regressor also appears in the middle trace as a shaded area that highlights the correlation of the granule cell activity with sensory stimuli. Open arrowheads highlight peaks that correlate with motor activity, but not sensory stimuli. Corresponding correlation coefficients of granule cell activity with the regressors are indicated. (ii and iii) The same as for (i) is shown, instead showing the activity of cells from (Eii) and (Eiii).