
|
Fig. S4
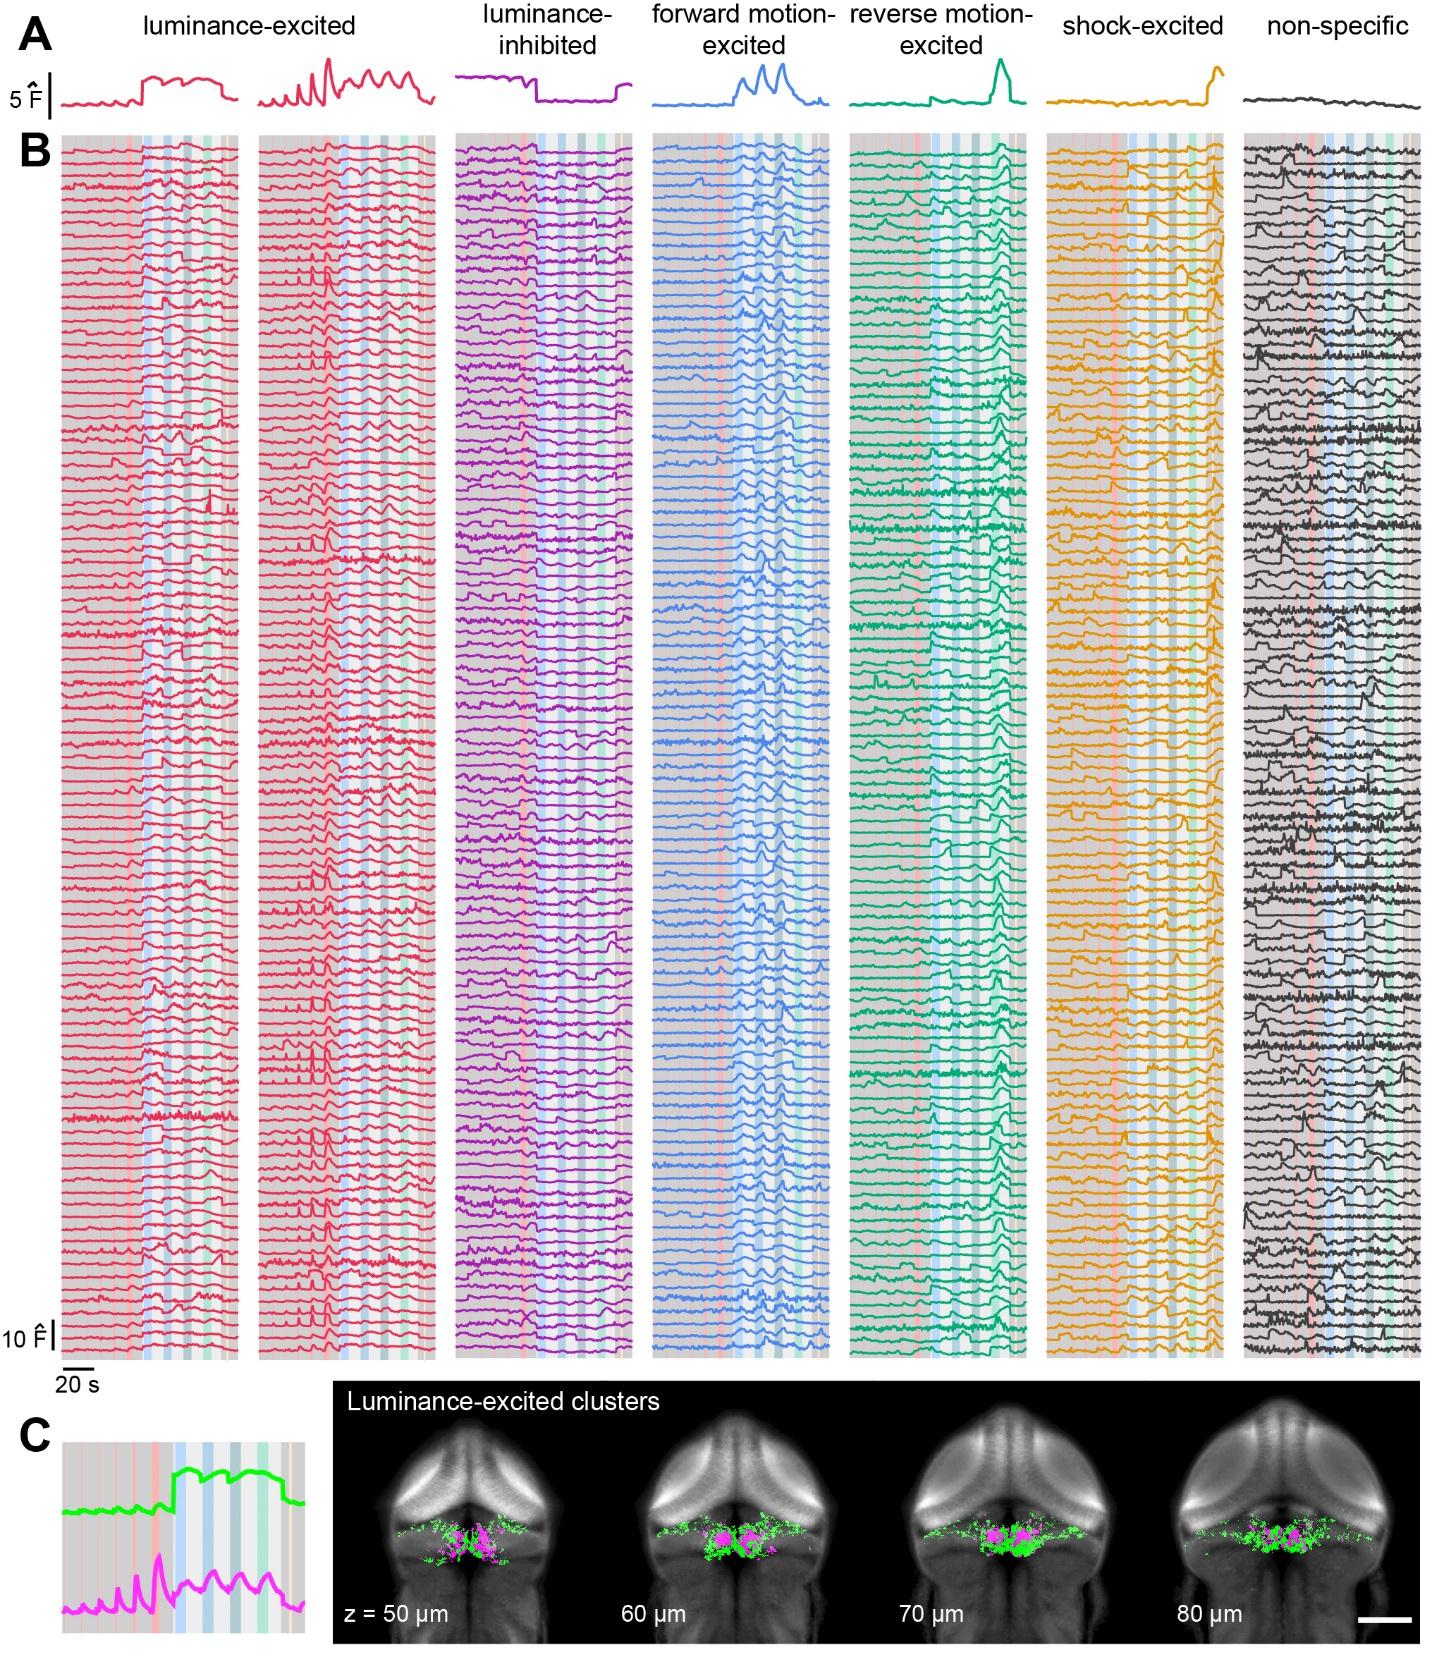
Detailed examination of response profiles within a cluster. Related to Figure 3.
A) The average response profile is shown for the seven granule cell clusters labelled as for Figure 3A. B) Each column shows the z-scored activity traces from one hundred randomly selected cells belonging to the cluster shown in (A). C) Left, based on their shared functional increase in activity when luminance increases, we group the two clusters of luminance-excited cells together in this study. Right, anatomical clustering of these two profiles separately (equivalent to the combined red cluster in Figure 3B) shows differences in location, with the smaller, magenta cluster more medially-located.