
- Title
-
LRRK2 knockdown in zebrafish causes developmental defects, neuronal loss, and synuclein aggregation
- Authors
- Prabhudesai, S., Bensabeur, F.Z., Abdullah, R., Basak, I., Baez, S., Alves, G., Holtzman, N.G., Larsen, J.P., Møller, S.G.
- Source
- Full text @ J. Neurosci. Res.
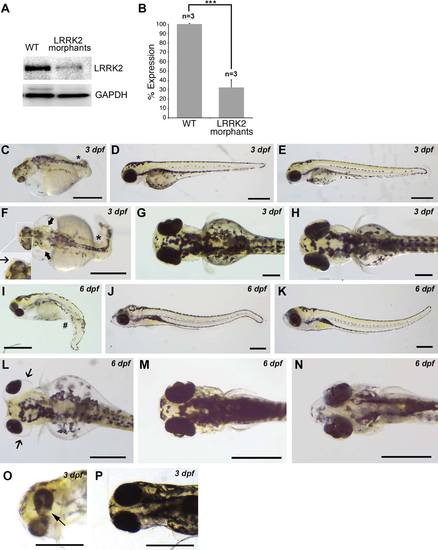
LRRK2 knockdown by translational MO produces axis curvature defects, ocular abnormalities, and edema. A: Western blot analysis showing LRRK2 expression in wt embryos and in LRRK2 morphant embryos using a LRRK2-specific antibody normalized to GAPDH. B: Quantification of LRRK2 expression normalized to GAPDH. Y-axis shows LRRK2 expression in LRRK2 morphant embryos as a percentage of LRRK2 expression in wt embryos. n = 3 experiments for each group; 12 embryos in each group in each experiment. C: Lateral view of a 3-dpf LRRK2 morphant embryo with axis curvature defects (asterisk). Lateral view of a 3-dpf LRRK2 5-base mismatch MO-injected embryo (D) and a 3-dpf wt embryo both showing a wt phenotype and straight tail (E). F: Dorsal view of a 3-dpf LRRK2 morphant embryo with axis curvature defects (asterisk) and with edema in otic vesicles (arrow in main image) and lens (arrow in inset). Dorsal view of a 3-dpf LRRK2 5-base mismatch MO-injected embryo (G) and a 3-dpf wt embryo both with normal lenses, otic vesicles, and a straight tail (H). I: Lateral view of a 6-dpf LRRK2 morphant embryo showing edema around the eyes and ventral curvature defects (bent tail; pound sign). Lateral view of a 6-dpf LRRK2 5-base mismatch MO-injected embryo (J) and a 6-dpf wt embryo both showing normal eye development and a straight tail (K). L: Dorsal view of a 6-dpf LRRK2 morphant showing distinct edema around the eyes (arrows). Dorsal view of a LRRK2 5-base mismatch MO-injected embryo (M) and a 6-dpf wt embryo both showing normal eyes (N). O: Ventral view of 3-dpf LRRK2 morphant showing coloboma in one of the eyes (arrow). P: Ventral view of a LRRK2 5-base mismatch MO-injected embryo showing normal eyes. n = 2,932 for LRRK2 translational morphants, n = 2,100 for LRRK2 5-base mismatch controls MO, n = 2,142 for wt. ***P < 0.001 (Student′s t-test). Scale bars = 0.5 mm. EXPRESSION / LABELING:
PHENOTYPE:
|
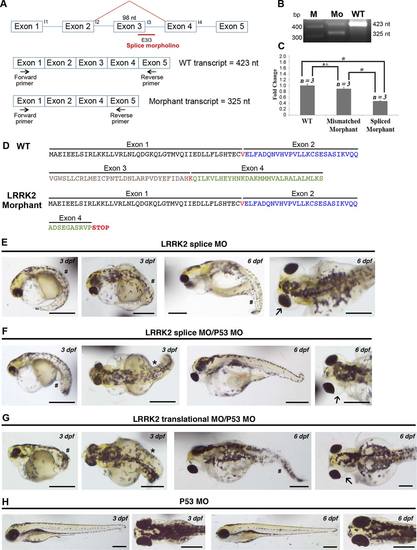
LRRK2 knockdown by splice MO produces the same phenotype as translational MO and coinjection of the p53 MO with either LRRK2 splice or translational MO does not rescue the LRRK2-specific phenotype. A: Schematic showing the binding of the splice MO to the intron 3 splice donor junction E3I3 causing deletion of exon 3. The position of the primers used in RT-PCR are shown. B: RT-PCR from RNA extracted from 72 hpf splice MO-injected and wt embryos showing the presence of reduced levels of wt product (423 nt) and the presence of the alternatively spliced smaller transcript (325 nt) in the morphants. C: Quantitative RT-PCR from RNA extracted from 72 hpf splice MO-injected, mismatch MO-injected, and wt embryos showing the presence of reduced levels (~50% reduction) of the LRRK2 transcript compared with the mismatch control and wt. D: Comparison between the amino acid sequence of the first four exons of the wt protein and the amino acid sequence of the aberrant LRRK2 protein in the splice morphant that has a premature stop codon in exon 4 due to the loss of exon 3. E: Lateral views of 3-dpf and 6-dpf embryos injected with LRRK2 splice MO showing bent tails (pound sign) and edema around eyes (arrow). F: Lateral views of 3-dpf and 6-dpf embryos coinjected with p53 MO and LRRK2 splice MO showing bent tails (pound sign), axis curvature defects (asterisk), and edema around eyes (arrow). Note that the p53 MO injection does not rescue the LRRK2 splice morphant phenotype. G: Lateral views of 3-dpf and 6-dpf embryos coinjected with p53 MO and LRRK2 translational MO showing bent tails (pound sign), axis curvature defects (asterisk), and edema around eyes (arrow). Note that the p53 MO injection does not rescue the LRRK2 translational morphant phenotype. H: Lateral views of 3-dpf and 6-dpf embryos injected with p53 alone as an additional control showing a wt phenotype. n = 1,260 for splice morphants, n = 500 for splice MO + p53 MO, n = 500 for translational MO + p53 MO, n = 500 for p53 MO alone. Scale bars = 0.5 mm. EXPRESSION / LABELING:
PHENOTYPE:
|

Rescue of the LRRK2 phenotypes by injecting human wt LRRK2 mRNA. A: Lateral view of a 3-dpf embryo injected with 4 ng LRRK2 translational MO showing axis curvature defect. B: Lateral view of a 3-dpf embryo coinjected with 4 ng LRRK2 translational MO and 200 pg human wt LRRK2 mRNA showing normal axis development. C: Dorsal view of a 3-dpf embryo injected with 4 ng LRRK2 translational MO showing axis curvature defect. D: Dorsal view of a 3-dpf embryo coinjected with 4 ng LRRK2 translational MO and 200 pg human wt LRRK2 mRNA showing normal axis development. E: Lateral view of a 6-dpf embryo injected with 4 ng LRRK2 translational MO showing edema in the entire body. F: Lateral view of a 6-dpf embryo coinjected with 4 ng LRRK2 translational MO and 200 pg human wt LRRK2 mRNA showing absence of any kind of edema. G: Dorsal view of a 6-dpf embryo injected with 4 ng LRRK2 translational MO showing distinct edema around the eyes (arrowheads). H: Dorsal view of a 6-dpf embryo coinjected with 4 ng LRRK2 translational MO and 200 pg human wt LRRK2 mRNA showing normal eyes with no edema. I: Ventral view of a 3-dpf embryo injected with 4 ng LRRK2 translational MO showing coloboma (arrow) in the left eye. J: Ventral view of a 3-dpf embryo coinjected with 4 ng LRRK2 translational MO and 200 pg human wt LRRK2 mRNA showing normal eye development. K: The number of embryos injected and the number of embryos alive for three experimental groups: LRRK2 translational (ATG) MO; LRRK2 translational (ATG) MO + 100 pg human wt LRRK2 mRNA and LRRK2 translational (ATG) MO + 200 pg human wt LRRK2 mRNA. L: Embryos were classified into four groups based on edema: no edema, mild edema (general nonspecific heart edema from injections), intermediate edema, and severe edema. Three groups based on curvature defects: no curvature defects, mild curvature defects, severe curvature defects (M) and two groups based on ocular defects: no ocular defects and ocular defects (N). Y-axis shows embryos in the different categories as a percentage of the total No. of embryos alive for embryos injected with 4 ng of translational MO, embryos injected with 4 ng of translational MO + 100 pg human wt LRRK2 mRNA, and embryos injected with 4 ng of translational MO + 200 pg human wt LRRK2 mRNA. n = 95 for translational MO-injected embryos, n = 120 for translational MO + 100 pg mRNA-injected embryos and n = 185 for translational MO + 200 pg mRNA-injected embryos. Scale bars = 0.5 mm. |

LRRK2 knockdown decreases the number of neurons, including DA neurons. A: Head of an embryo coinjected with HuC-GFP and mismatch control MO. B: Head of a LRRK2 morphant embryo coinjected with HuC-GFP and LRRK2 translational MO. C: Tail of an embryo coinjected with HuC-GFP and mismatch control MO. D: Tail of a LRRK2 morphant embryo coinjected with HuC-GFP and LRRK2 translational MO. LRRK2 knockdown causes a reduction in neurons compared with the mismatch control MO-injected embryos. E: Quantification of Huc-GFP-positive cells in embryos showing a significant reduction in the average number of Huc-GFP-positive cells in the LRRK2 translational MO-injected embryos compared with the wt and mismatch control MO-injected embryos. n = 8 for each group, images of eight embryos from eight different individual injection experiments were analyzed for each group, ***P < 0.001. F: Head of a representative wt embryo at 72 hpf immunostained with an anti-TH antibody showing the normal complement of DA neurons (green fluorescence). G: Head of a representative LRRK2 morphant embryo at 72 hpf immunostained with an anti-TH antibody showing a significant reduction of DA neurons compared with wt embryos (green fluorescence). H: Quantification of TH-positive cells in wt and LRRK2 morphant embryos. n = 9 for each group, ***P < 0.001. I: Acridine orange staining of wt, LRRK2 5-nt mismatch control and LRRK2 morphant embryos at 48 hpf showing extensive cell death in the tail region surrounding the bend of the LRRK2 morphant embryos compared with wt and the 5-nt mismatch control. White squares in the upper panel denote the higher magnification regions shown in the lower panel. J: Quantification of acridine orange-positive cells in the tail bend and in the entire embryo showing significantly higher numbers of acridine orange-positive cells in the LRRK2 morphants compared with wt and LRRK2 5-base mismatch control embryos. n = 5 for all groups, **P < 0.01. Scale bars = 100 µm. EXPRESSION / LABELING:
PHENOTYPE:
|
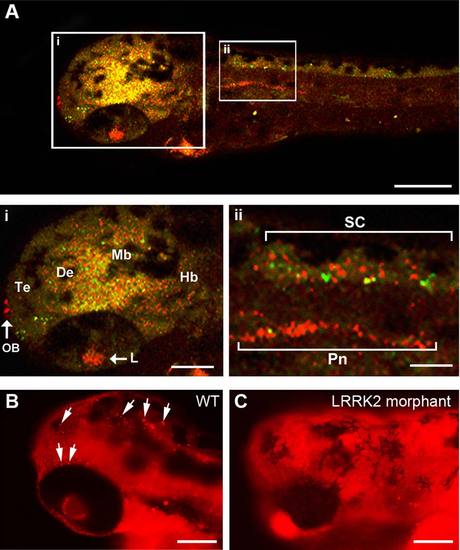
LRRK2 expression in wild-type embryos. A: LRRK2 is expressed throughout the brain, in the lens, in the heart, in the pronephros, and in the spinal cord (red). Neuronal labeling was visualized by GFP expression driven by the HuC promoter (green). Overlay of the red and green channels showing a mixture of overlap of signal (yellow) but also separate red and green signals demonstrating that LRRK2 is expressed both in Huc-GFP neurons and surrounding the neurons. Te, telencephalon; De, diencephalon; Mb, midbrain; Hb, hindbrain; Pn, pronephros; SC, spinal cord; L, lens; H, heart′ OB, olfactory bulb. B,C: Comparison of LRRK2 protein expression using immunofluorescence between wt (B) and LRRK2 translational MO-injected (C) embryos. LRRK2 protein expression is reduced in the LRRK2 morphants (C) compared with wt embryos (B). White arrows indicate examples of specific and punctate immunostaining in wt embryos. The background red staining in C appears higher than in B because the exposure was increased in C to verify less specific LRRK2 cross-reactivity. Scale bars = 100 µm in A-C; 50 µm in i,ii. |
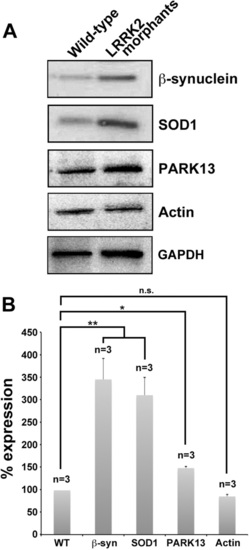
Decreased LRRK2 level affects the abundance of central PD associated proteins. A: Western blot analysis of protein lysates from 3-dpf wt and LRRK2 morphant embryos using antibodies for β-synuclein, SOD1, and PARK13. LRRK2 knockdown causes upregulation of β-synuclein, SOD1, and PARK13. Both actin and GAPDH were used as loading controls. B: Quantification of the Western blot analysis against the GAPDH control. n = 3 for all groups, 12 embryos in each group in each experiment. *P < 0.05, **P < 0.01 EXPRESSION / LABELING:
PHENOTYPE:
|
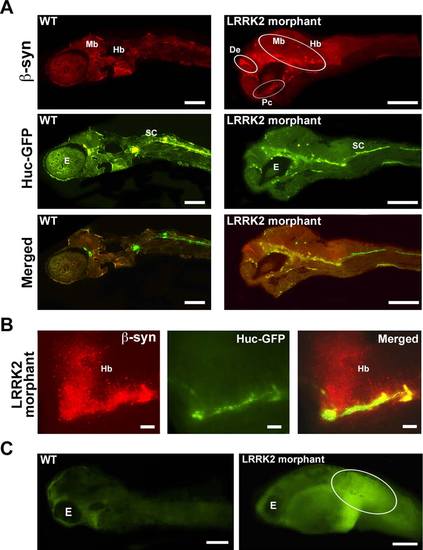
Decreased LRRK2 level causes β-synuclein aggregation. A: Fluorescence microscopy images of 10-µm sections of 48 hpf wt embryos injected with HuC-GFP (green) and LRRK2 morphants coinjected with HuC-GFP (green) and the LRRK2 translational MO stained using the anti-β-synuclein antibody. β-Synuclein aggregates (red) were observed near the diencephalon (De), midbrain (Mb), hindbrain (Hb), and postoptic commissure (Pc) of the LRRK2 morphants but not in wt embryos. E, eye; De; diencephalon; Mb, midbrain; Hb, hindbrain; Pc, postoptic commisure. B: High levels of β-synuclein aggregates (red) were detected in the hindbrain region of the LRRK2 morphants. C: ROS staining of 72 hpf wt and LRRK2 morphant embryos showing high ROS levels in the tail region surrounding the bend in the LRRK2 morphant (oval) compared with wt embryos. Scale bars = 100 µm in A,C; 250 µm in B. |

LRRK2 knockdown causes mislocalization of the Na+/K+ ATPase protein in the kidneys. A,B: Immunofluorescence images of 10-µm sections of 60 hpf wt embryos (A) and LRRK2 morphants (B) injected with the LRRK2 translational MO and stained using a Na+/K+ ATPase antibody and DAPI. The Na+/K+ ATPase is localized to the basolateral side of the cells in sections from wt embryos. In contrast, the Na+/K+ ATPase is localized to the apicolateral side of the cells in sections from LRRK2 morphants. |