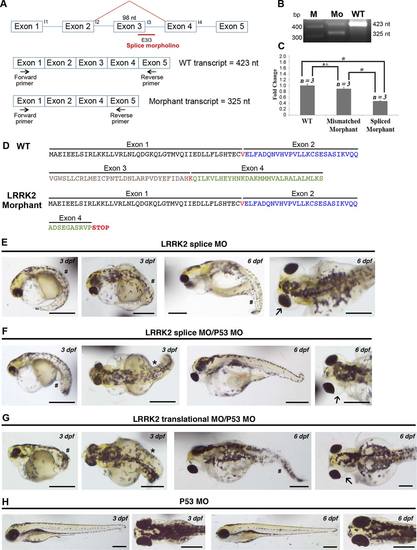
LRRK2 knockdown by splice MO produces the same phenotype as translational MO and coinjection of the p53 MO with either LRRK2 splice or translational MO does not rescue the LRRK2-specific phenotype. A: Schematic showing the binding of the splice MO to the intron 3 splice donor junction E3I3 causing deletion of exon 3. The position of the primers used in RT-PCR are shown. B: RT-PCR from RNA extracted from 72 hpf splice MO-injected and wt embryos showing the presence of reduced levels of wt product (423 nt) and the presence of the alternatively spliced smaller transcript (325 nt) in the morphants. C: Quantitative RT-PCR from RNA extracted from 72 hpf splice MO-injected, mismatch MO-injected, and wt embryos showing the presence of reduced levels (~50% reduction) of the LRRK2 transcript compared with the mismatch control and wt. D: Comparison between the amino acid sequence of the first four exons of the wt protein and the amino acid sequence of the aberrant LRRK2 protein in the splice morphant that has a premature stop codon in exon 4 due to the loss of exon 3. E: Lateral views of 3-dpf and 6-dpf embryos injected with LRRK2 splice MO showing bent tails (pound sign) and edema around eyes (arrow). F: Lateral views of 3-dpf and 6-dpf embryos coinjected with p53 MO and LRRK2 splice MO showing bent tails (pound sign), axis curvature defects (asterisk), and edema around eyes (arrow). Note that the p53 MO injection does not rescue the LRRK2 splice morphant phenotype. G: Lateral views of 3-dpf and 6-dpf embryos coinjected with p53 MO and LRRK2 translational MO showing bent tails (pound sign), axis curvature defects (asterisk), and edema around eyes (arrow). Note that the p53 MO injection does not rescue the LRRK2 translational morphant phenotype. H: Lateral views of 3-dpf and 6-dpf embryos injected with p53 alone as an additional control showing a wt phenotype. n = 1,260 for splice morphants, n = 500 for splice MO + p53 MO, n = 500 for translational MO + p53 MO, n = 500 for p53 MO alone. Scale bars = 0.5 mm.
|
