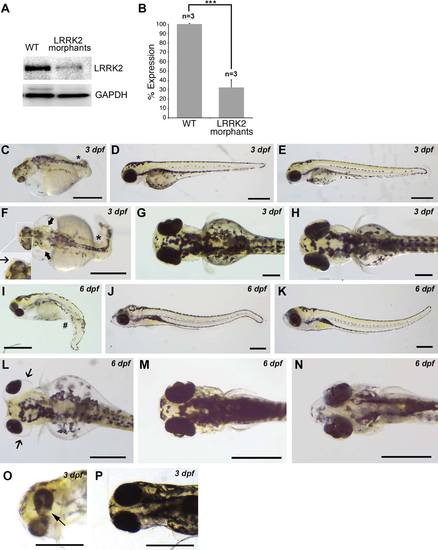
LRRK2 knockdown by translational MO produces axis curvature defects, ocular abnormalities, and edema. A: Western blot analysis showing LRRK2 expression in wt embryos and in LRRK2 morphant embryos using a LRRK2-specific antibody normalized to GAPDH. B: Quantification of LRRK2 expression normalized to GAPDH. Y-axis shows LRRK2 expression in LRRK2 morphant embryos as a percentage of LRRK2 expression in wt embryos. n = 3 experiments for each group; 12 embryos in each group in each experiment. C: Lateral view of a 3-dpf LRRK2 morphant embryo with axis curvature defects (asterisk). Lateral view of a 3-dpf LRRK2 5-base mismatch MO-injected embryo (D) and a 3-dpf wt embryo both showing a wt phenotype and straight tail (E). F: Dorsal view of a 3-dpf LRRK2 morphant embryo with axis curvature defects (asterisk) and with edema in otic vesicles (arrow in main image) and lens (arrow in inset). Dorsal view of a 3-dpf LRRK2 5-base mismatch MO-injected embryo (G) and a 3-dpf wt embryo both with normal lenses, otic vesicles, and a straight tail (H). I: Lateral view of a 6-dpf LRRK2 morphant embryo showing edema around the eyes and ventral curvature defects (bent tail; pound sign). Lateral view of a 6-dpf LRRK2 5-base mismatch MO-injected embryo (J) and a 6-dpf wt embryo both showing normal eye development and a straight tail (K). L: Dorsal view of a 6-dpf LRRK2 morphant showing distinct edema around the eyes (arrows). Dorsal view of a LRRK2 5-base mismatch MO-injected embryo (M) and a 6-dpf wt embryo both showing normal eyes (N). O: Ventral view of 3-dpf LRRK2 morphant showing coloboma in one of the eyes (arrow). P: Ventral view of a LRRK2 5-base mismatch MO-injected embryo showing normal eyes. n = 2,932 for LRRK2 translational morphants, n = 2,100 for LRRK2 5-base mismatch controls MO, n = 2,142 for wt. ***P < 0.001 (Student′s t-test). Scale bars = 0.5 mm.
|
