
- Title
-
Whole-genome expression profile in zebrafish embryos after chronic exposure to morphine: identification of new genes associated with neuronal function and mu opioid receptor expression
- Authors
- Herrero-Turrión, M.J., Rodríguez-Martín, I., López-Bellido, R., Rodríguez, R.E.
- Source
- Full text @ BMC Genomics

Quantitative real-time PCR (RT-qPCR) was used to validate the microarray data. The genes selected showed similar expression changes when assessed by RT-qPCR as determined by microarray analysis. Data are presented as morphine vs. control fold changes. EXPRESSION / LABELING:
|
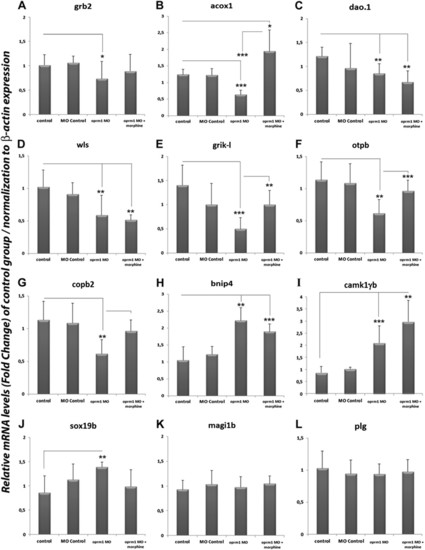
Knockdown of µ opioid receptor ( oprm1 ). Expression levels of grb2, acox1, dao.1, wls, grik-l, otpb, copb2, bnip4, camk1gb, sox19b, magi1b and plg of the Control group, the Morpholine (MO) control, Morpholine oprm1 (oprm1-MO) and oprm1-MO exposure to morphine (oprm1-MO + morphine). The expression levels were quantified using RT-qPCR analysis and were normalized to β-actin expression. Each bar represents the FC ± SD (n = 8). Data were analyzed by one-way ANOVA and using the Tukey post-hoc test. P values of < 0.05 being considered statistically significant (***p < 0.001; **p < 0.01; *p <0.05). EXPRESSION / LABELING:
|

unillustrated text statements |