
IMAGE
Fig. 5
Image
|
Figure Caption
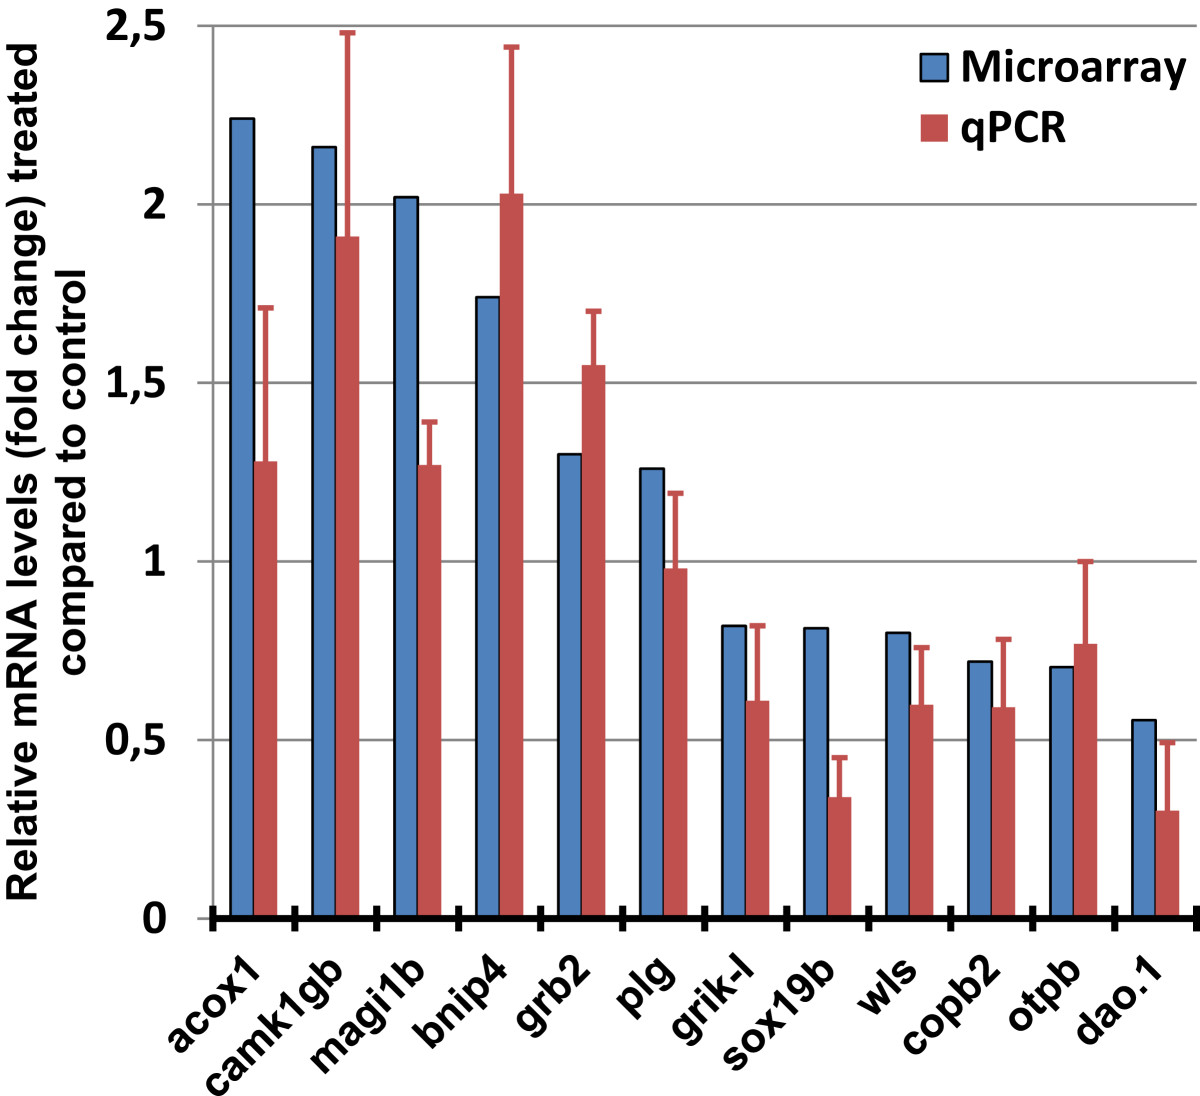
Fig. 5
Quantitative real-time PCR (RT-qPCR) was used to validate the microarray data. The genes selected showed similar expression changes when assessed by RT-qPCR as determined by microarray analysis. Data are presented as morphine vs. control fold changes.
Figure Data
Acknowledgments
This image is the copyrighted work of the attributed author or publisher, and
ZFIN has permission only to display this image to its users.
Additional permissions should be obtained from the applicable author or publisher of the image.
Full text @ BMC Genomics