
- Title
-
Intravital correlated microscopy reveals differential macrophage and microglial dynamics during resolution of neuroinflammation
- Authors
- van Ham, T.J., Brady, C.A., Kalicharan, R.D., Oosterhof, N., Kuipers, J., Veenstra-Algra, A., Sjollema, K.A., Peterson, R.T., Kampinga, H.H., Giepmans, B.N.
- Source
- Full text @ Dis. Model. Mech.
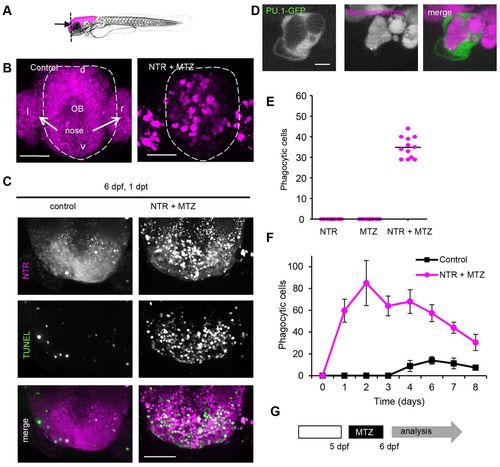
Controlled ablation of brain cells is followed by phagocytosis and functional tissue recovery. (A) Mid-sagittal schematic indicating NTR and fluorescent transgene expression in the brain. (B) Frontal fluorescent images of forebrain, including tip of olfactory bulb and olfactory epithelium, showing expression of fluorescent protein in brain cells expressing NTR in control animals (non-treated) and phagocytosed fluorescent protein in phagocytic cells in 3-day-old MTZ-treated animals 1 day post-treatment. (C) Dorsal images of anterior tip of forebrain in 6-day-old control larvae and larvae treated at 5 dpf, showing TUNEL-marked apoptotic cells in green. Animals were treated overnight with 2 mM MTZ at 5 dpf. (D) Phagocytic cell marked by mCherry-positive phagosome expressing PU.1-driven GFP in cytoplasm in 3 dpf animals. (E) Number of phagocytic cells in the forebrain 1 day after ablation in untreated 6 dpf NTR animals, control animals treated with MTZ and NTR animals treated with MTZ (n=12). Phagocytic cells were quantified by counting bright-fluorescently marked phagocytes, which can be distinguished from neurons showing low fluorescence, in the forebrains of treated and control animals. (F) Phagocytic cells in whole brain of control (untreated) and NTR animals treated with MTZ, 1–8 days post-treatment (n=8). Animals were treated at 5 dpf. (G) MTZ treatment regime causing brain cell death, phagocytic response and functional recovery (supplementary material Fig. S1). Experimental sequence used in C, E, F and rest of manuscript: 5-day-old pdf larvae were treated with MTZ for 16 hours followed by analysis. l and r indicate left and right; d and v, indicate dorsal and ventral; OB, olfactory bulb. Scale bars: 50 µm (B,C), 5 μm (D). See also supplementary material Fig. S1 and Movie 1. |
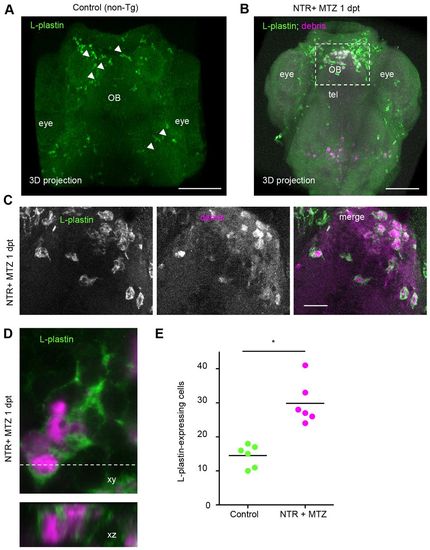
Phagocytic cells are L-plastin-positive leukocytes. (A,B) L-plastin fluorescent marked cells (green) in (A) whole mount stained control (non-transgenic non-treated) and (B) NTR + MTZ larvae at 1 day post-treatment (dpt). (C) L-plastin marked cells in forebrain of NTR animals treated with MTZ 1 day after treatment, showing cytoplasmic mCherry inclusions (magenta) and amoeboid morphology. (D) High magnification of L-plastin-expressing leukocyte, and orthogonal view, showing cytoplasmic inclusions of mCherry in NTR MTZ-treated animals 1 day post-treatment. (E) Quantification of L-plastin-expressing leukocytes within forebrain, in control and ablated larvae 3 days post-treatment, shows twofold increase in NTR animals treated with MTZ (n=6) (*Pd0.05). Z-stacks of ~80 µm were used for quantification. OB, olfactory bulb; tel, telencephalon. Scale bars: 100 μm (A,B), 20 μm (C). See also supplementary material Movie 2. |
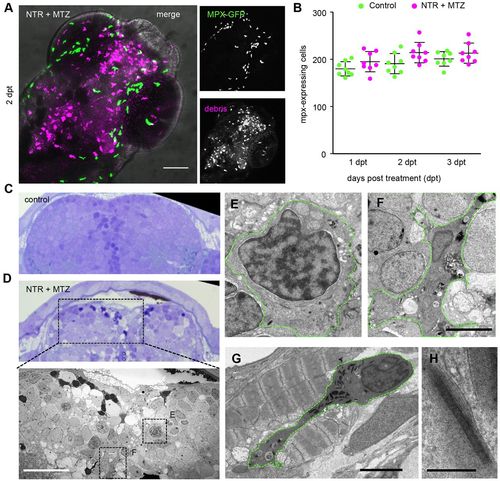
Neutrophils are not affected by cell ablation in the brain. (A) Myeloperoxidase (mpx)-expressing neutrophils (green) in NTR MTZ-treated brain (magenta) 2 days post-treatment. (B) Total numbers of mpx-expressing neutrophils in whole animal controls and 1–3 days post-treatment (n=10 animals). Numbers do not differ significantly. (C,D) Toluidine Blue stained 1 micron section of brain from control and NTR MTZ-treated animals. Control brain show homogeneous cellular profiles, whereas NTR animals treated with MTZ shows cells irregular in staining density, cytoplasmic inclusions and dark pyknotic nuclei. (D, lower panel) Electron micrograph of region marked in D shows features not found in control brains, including dark stained cells, phagocytic leukocytes and spongy appearance of tissue (also see Fig. 4). (E) High magnification of monocyte-like cell in D. (F) High magnification view of phagocytic cell in D. (G,H) Neutrophil (G) marked by cigar-shaped granules (H), located between jaw muscle cells, showing characteristic striping pattern not found in the brain. Scale bars: 50 μm (A,D, lower panel), 5 μm (F,G), 200 nm (H). |
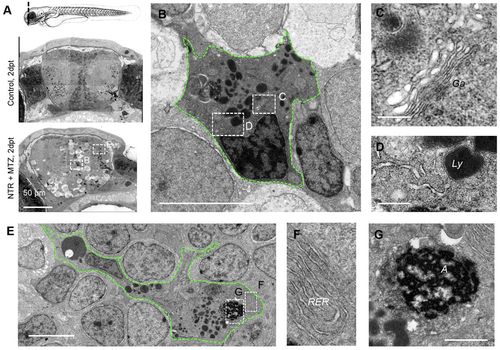
Phagocytes with ultrastructural microglial features appear following neuronal cell death. (A) Nanotomy of brains of 7 dpf control and NTR animals treated with MTZ 2 days post treatment, showing features specific to the NTR degenerative brain, including phagocytic leukocytes, dark cells undergoing cell death and spongy appearance of neural tissue in comparison with control. (B–D) High magnification view of phagocytic cell in A (lower panel) showing typical amoeboid microglial features including prominent Golgi apparatus (Ga; C), inclusions including lysosomal vacuoles (Ly; D) and distinctive long stretches of endoplasmic reticulum (D). (E–G) High magnification view of phagocytic cell in A showing typical amoeboid microglial cell features, including rough endoplasmic reticulum (RER; F) and engulfed cell corpse (‘A’; G). Scale bars: 50 μm (A), 200 nm (C,D), 5 μm (B,E), 1 μm (G). |
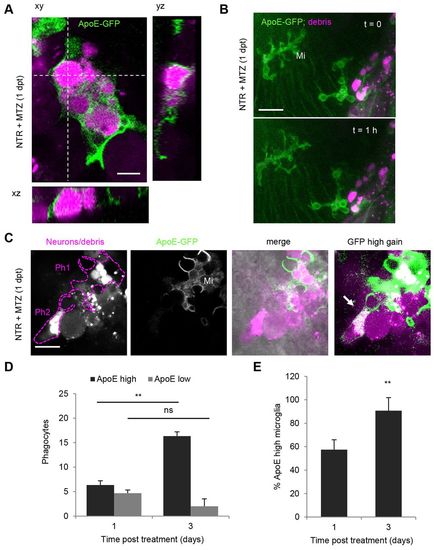
Mononuclear phagocytes are ApoE-expressing microglia and macrophages. (A) ApoE-driven membrane-targeted GFP expression in mCherry-positive phagocytes in NTR-ablated larval brain showing complete internalization of mCherry marked phagosomes.(B) Brain of NTR-ablated larva showing ramified ApoE-GFP microglia next to region of cell death and phagocytic macrophage and microglia. (C) Two mCherry-positive phagocytes in NTR-ablated larvae, one showing membranous ApoE-GFP expression and amoeboid morphology (Ph1), the other showing no membrane staining under normal imaging conditions (Ph2) (also see supplementary material Movies 3, 4). Upon high power excitation of GFP, a low level of ApoE-GFP-expressing population becomes apparent (arrow, right panel). (D) Number of phagocytes in the forebrain of NTR-ablated larvae and fraction coexpressing microglial ApoE-GFP at 1 and 3 days post-treatment. Z-stacks of 50–70 μm were used for quantification. (E) Fraction of ApoE-GFP-expressing microglia from total number of phagocytes 1 and 3 days post-ablation. Error bars indicate standard deviation; n=3 animals for 1 and 3 days post-treatment, respectively; **Pd0.01; ns, not significant. Mi, microglia. Scale bars: 5 μm (A), 20 μm (B), 10 μm (C). See also supplementary material Movies 3–6. |
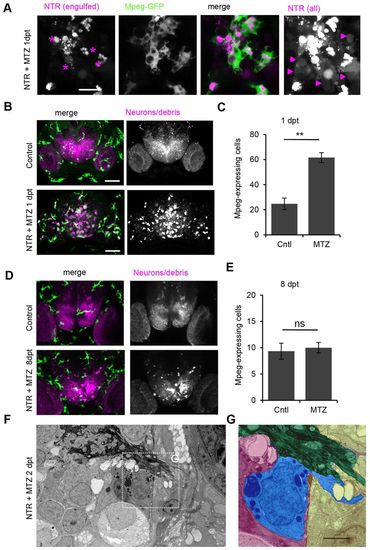
Phagocytic responders are mononuclear phagocytes. (A) Macrophage-expressed gene 1 (mpeg1)-driven GFP expression-positive phagocytes with amoeboid morphology in NTR-ablated larva 1 day post-treatment. (B) mpeg1-GFP expression in forebrain of control and treated larvae showing that mpeg1-positive (green) leukocytes co-localize with phagocytized debris in NTR animals treated with MTZ (also see supplementary material Movie 7). (C) Number of mpeg-expressing cells in control forebrain (n=4) and increased numbers in NTR MTZ-treated larvae (n=7) (Pd0.01). (D) mpeg-GFP expression in NTR control and treated larvae 8 days post-ablation. (E) Number of mpeg-expressing cells in control forebrain (n=3) and similar numbers in NTR larvae treated with MTZ (n=3) 8 days post-ablation, quantified from 80 μm z-stacks. (F) Electron micrograph of forebrain 2 days post-treatment showing olfactory nerve entering the brain. (G) False color high magnification view of phagocyte (blue) in F next to olfactory nerve (green) within meninges, with extended cytoplasmic process protruding outside of brain (blue). Error bars indicate standard deviation. **Pd0.01; ns, not significant. Scale bars: 10 μm (A), 50 μm (B,D), 2 μm (G). See also supplementary material Movies 7, 8. |
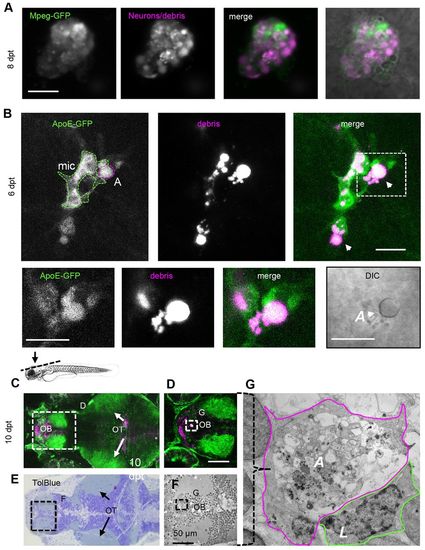
Apoptotic phagocytes are engulfed by microglia. (A) Large mpeg-GFP-expressing phagocyte 8 days post-treatment (dpt) showing cytoplasmic mCherry-positive vacuoles (magenta) and mpeg-GFP expression (green), suggestive of an apoptotic phagocyte. (B) ApoE-expressing microglia (mic; green) phagocytizing non-motile, apoptotic phagocytea (‘A’; magenta, arrowheads) (supplementary material Movie 9). The boxed area is shown below at higher magnification. The DIC image at the bottom right shows that the phagocyte being engulfed by microglia is apoptotic (reflective button-like rounded cell body). Data were recorded using intravital imaging of three distinct channels to visualize NTR, ApoE-GFP and apoptotic cells. The schematic above C indicates the region shown in C and E. (C) Optical section of live forebrain and optic tectum region of NTR animals treated with MTZ 10 days after treatment; green indicates GFP expression (supplementary material Movie 10). (D) Higher magnification of forebrain as shown in C. (E) Toluidine Blue stained section of region of brain of same animal as shown in C. (F) Electron micrograph of region indicated in E. (G) Electron micrograph of phagocytic profile observed in live imaging, showing large apoptotic cytoplasm including vacuoles and lysosomal debris demarcated with solid purple line, partly surrounded by a leukocytic cell (‘L’). ‘A’, apoptotic phagocyte; mic, microglia; OB, olfactory bulb; OT, optic tecti. Scale bars: 10 μm (A,B), 50 μm (D). See also supplementary material Movies 9–11. |
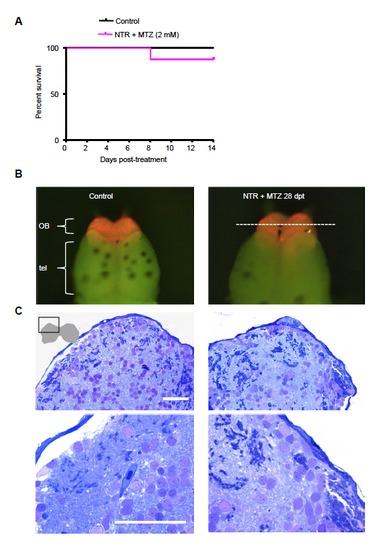
(A) Survival over 2 weeks of control and neuro-NTR larvae after metronidazole treatment. Larvae are treated with 2 mM metronidazole (MTZ) at 5 days post fertilization. MTZ is washed out after overnight (16 h) incubation. These larvae are allowed to grow up initially in petri dishes at 28ºC for 2 days post treatment, and in small tanks afterwards during which they are fed paramecia daily. Control animals (n=44), NTR larvae treated with MTZ (n=33). (B) Dissected control and NTR treated brain 4 weeks post-treatment showing mCherry fluorescence in the olfactory bulb. (C) Toluidene blue stained sections of control and NTR treated brains shown in (B). Region shown is indicated by schematic representation of the two lobes of the olfactory bulb. OB indicates olfactory bulb, Tel indicates telencephalon. |