
Fig. S1
- ID
- ZDB-FIG-140715-65
- Publication
- van Ham et al., 2014 - Intravital correlated microscopy reveals differential macrophage and microglial dynamics during resolution of neuroinflammation
- Other Figures
- All Figure Page
- Back to All Figure Page
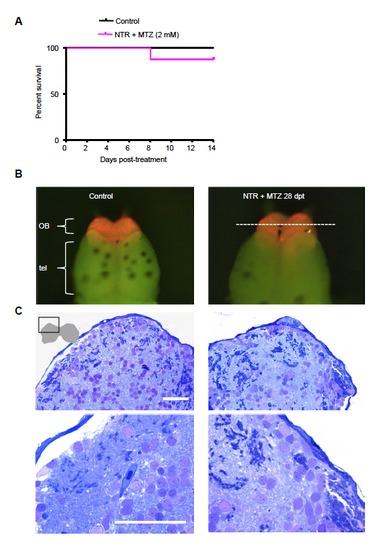
(A) Survival over 2 weeks of control and neuro-NTR larvae after metronidazole treatment. Larvae are treated with 2 mM metronidazole (MTZ) at 5 days post fertilization. MTZ is washed out after overnight (16 h) incubation. These larvae are allowed to grow up initially in petri dishes at 28ºC for 2 days post treatment, and in small tanks afterwards during which they are fed paramecia daily. Control animals (n=44), NTR larvae treated with MTZ (n=33). (B) Dissected control and NTR treated brain 4 weeks post-treatment showing mCherry fluorescence in the olfactory bulb. (C) Toluidene blue stained sections of control and NTR treated brains shown in (B). Region shown is indicated by schematic representation of the two lobes of the olfactory bulb. OB indicates olfactory bulb, Tel indicates telencephalon. |