
Fig. 2
- ID
- ZDB-FIG-140714-37
- Publication
- van Ham et al., 2014 - Intravital correlated microscopy reveals differential macrophage and microglial dynamics during resolution of neuroinflammation
- Other Figures
- All Figure Page
- Back to All Figure Page
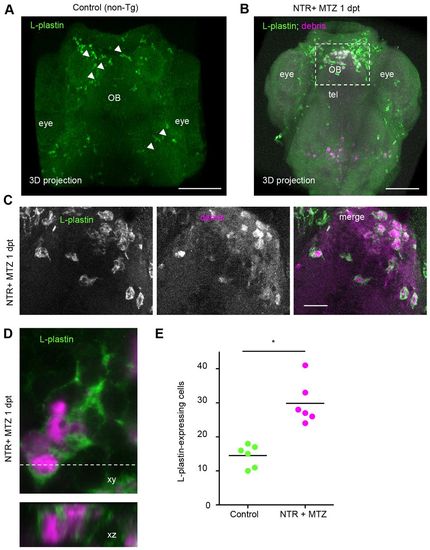
Phagocytic cells are L-plastin-positive leukocytes. (A,B) L-plastin fluorescent marked cells (green) in (A) whole mount stained control (non-transgenic non-treated) and (B) NTR + MTZ larvae at 1 day post-treatment (dpt). (C) L-plastin marked cells in forebrain of NTR animals treated with MTZ 1 day after treatment, showing cytoplasmic mCherry inclusions (magenta) and amoeboid morphology. (D) High magnification of L-plastin-expressing leukocyte, and orthogonal view, showing cytoplasmic inclusions of mCherry in NTR MTZ-treated animals 1 day post-treatment. (E) Quantification of L-plastin-expressing leukocytes within forebrain, in control and ablated larvae 3 days post-treatment, shows twofold increase in NTR animals treated with MTZ (n=6) (*Pd0.05). Z-stacks of ~80 µm were used for quantification. OB, olfactory bulb; tel, telencephalon. Scale bars: 100 μm (A,B), 20 μm (C). See also supplementary material Movie 2. |