
Fig. 6
- ID
- ZDB-FIG-140714-41
- Publication
- van Ham et al., 2014 - Intravital correlated microscopy reveals differential macrophage and microglial dynamics during resolution of neuroinflammation
- Other Figures
- All Figure Page
- Back to All Figure Page
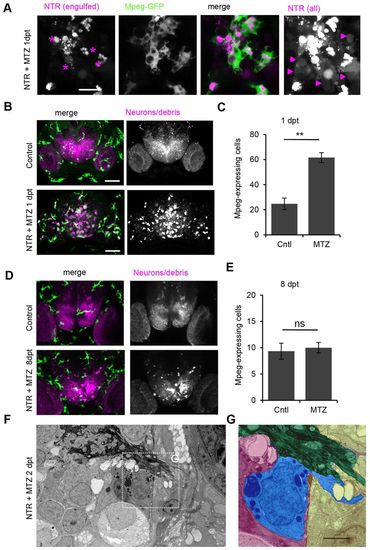
Phagocytic responders are mononuclear phagocytes. (A) Macrophage-expressed gene 1 (mpeg1)-driven GFP expression-positive phagocytes with amoeboid morphology in NTR-ablated larva 1 day post-treatment. (B) mpeg1-GFP expression in forebrain of control and treated larvae showing that mpeg1-positive (green) leukocytes co-localize with phagocytized debris in NTR animals treated with MTZ (also see supplementary material Movie 7). (C) Number of mpeg-expressing cells in control forebrain (n=4) and increased numbers in NTR MTZ-treated larvae (n=7) (Pd0.01). (D) mpeg-GFP expression in NTR control and treated larvae 8 days post-ablation. (E) Number of mpeg-expressing cells in control forebrain (n=3) and similar numbers in NTR larvae treated with MTZ (n=3) 8 days post-ablation, quantified from 80 μm z-stacks. (F) Electron micrograph of forebrain 2 days post-treatment showing olfactory nerve entering the brain. (G) False color high magnification view of phagocyte (blue) in F next to olfactory nerve (green) within meninges, with extended cytoplasmic process protruding outside of brain (blue). Error bars indicate standard deviation. **Pd0.01; ns, not significant. Scale bars: 10 μm (A), 50 μm (B,D), 2 μm (G). See also supplementary material Movies 7, 8. |