
Fig. 5
- ID
- ZDB-FIG-140714-40
- Publication
- van Ham et al., 2014 - Intravital correlated microscopy reveals differential macrophage and microglial dynamics during resolution of neuroinflammation
- Other Figures
- All Figure Page
- Back to All Figure Page
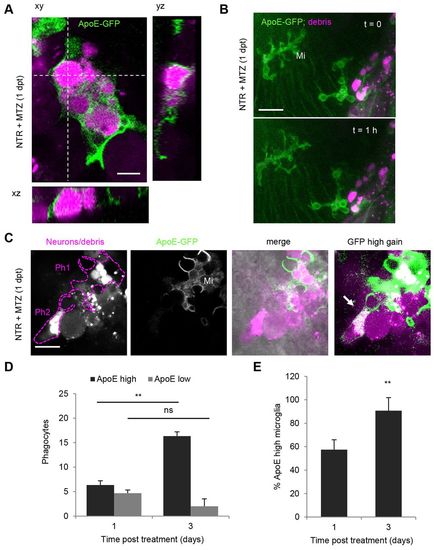
Mononuclear phagocytes are ApoE-expressing microglia and macrophages. (A) ApoE-driven membrane-targeted GFP expression in mCherry-positive phagocytes in NTR-ablated larval brain showing complete internalization of mCherry marked phagosomes.(B) Brain of NTR-ablated larva showing ramified ApoE-GFP microglia next to region of cell death and phagocytic macrophage and microglia. (C) Two mCherry-positive phagocytes in NTR-ablated larvae, one showing membranous ApoE-GFP expression and amoeboid morphology (Ph1), the other showing no membrane staining under normal imaging conditions (Ph2) (also see supplementary material Movies 3, 4). Upon high power excitation of GFP, a low level of ApoE-GFP-expressing population becomes apparent (arrow, right panel). (D) Number of phagocytes in the forebrain of NTR-ablated larvae and fraction coexpressing microglial ApoE-GFP at 1 and 3 days post-treatment. Z-stacks of 50–70 μm were used for quantification. (E) Fraction of ApoE-GFP-expressing microglia from total number of phagocytes 1 and 3 days post-ablation. Error bars indicate standard deviation; n=3 animals for 1 and 3 days post-treatment, respectively; **Pd0.01; ns, not significant. Mi, microglia. Scale bars: 5 μm (A), 20 μm (B), 10 μm (C). See also supplementary material Movies 3–6. |