
Fig. 1
- ID
- ZDB-FIG-140714-36
- Publication
- van Ham et al., 2014 - Intravital correlated microscopy reveals differential macrophage and microglial dynamics during resolution of neuroinflammation
- Other Figures
- All Figure Page
- Back to All Figure Page
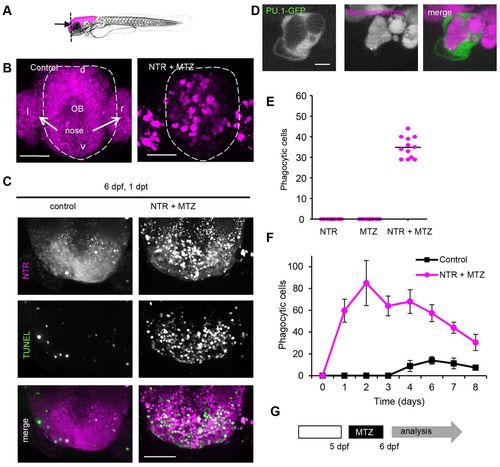
Controlled ablation of brain cells is followed by phagocytosis and functional tissue recovery. (A) Mid-sagittal schematic indicating NTR and fluorescent transgene expression in the brain. (B) Frontal fluorescent images of forebrain, including tip of olfactory bulb and olfactory epithelium, showing expression of fluorescent protein in brain cells expressing NTR in control animals (non-treated) and phagocytosed fluorescent protein in phagocytic cells in 3-day-old MTZ-treated animals 1 day post-treatment. (C) Dorsal images of anterior tip of forebrain in 6-day-old control larvae and larvae treated at 5 dpf, showing TUNEL-marked apoptotic cells in green. Animals were treated overnight with 2 mM MTZ at 5 dpf. (D) Phagocytic cell marked by mCherry-positive phagosome expressing PU.1-driven GFP in cytoplasm in 3 dpf animals. (E) Number of phagocytic cells in the forebrain 1 day after ablation in untreated 6 dpf NTR animals, control animals treated with MTZ and NTR animals treated with MTZ (n=12). Phagocytic cells were quantified by counting bright-fluorescently marked phagocytes, which can be distinguished from neurons showing low fluorescence, in the forebrains of treated and control animals. (F) Phagocytic cells in whole brain of control (untreated) and NTR animals treated with MTZ, 1–8 days post-treatment (n=8). Animals were treated at 5 dpf. (G) MTZ treatment regime causing brain cell death, phagocytic response and functional recovery (supplementary material Fig. S1). Experimental sequence used in C, E, F and rest of manuscript: 5-day-old pdf larvae were treated with MTZ for 16 hours followed by analysis. l and r indicate left and right; d and v, indicate dorsal and ventral; OB, olfactory bulb. Scale bars: 50 µm (B,C), 5 μm (D). See also supplementary material Fig. S1 and Movie 1. |