
- Title
-
Dynamic Association with Donor Cell Filopodia and Lipid-Modification Are Essential Features of Wnt8a during Patterning of the Zebrafish Neuroectoderm
- Authors
- Luz, M., Spannl-Müller, S., Özhan, G., Kagermeier-Schenk, B., Rhinn, M., Weidinger, G., and Brand, M.
- Source
- Full text @ PLoS One
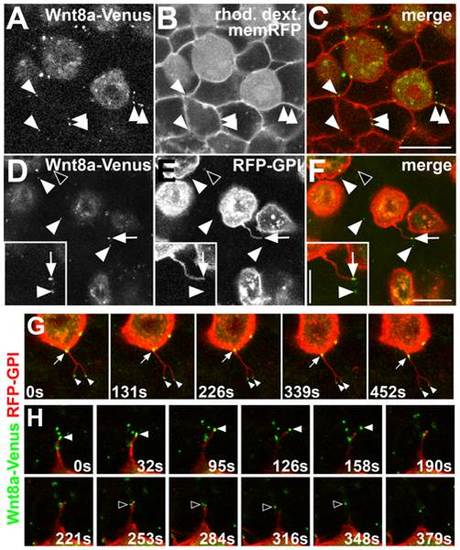
Wnt8a-Venus is membrane associated and released via filopodial processes in the live embryo. Confocal in vivo imaging of Wnt8a sub-cellular localization at the animal pole of 60–90% epiboly embryos. (A–C) Wnt8a-Venus expressing cells colabeled with rhodamine dextran (rhod. dextr., cytoplasmic) transplanted into a host embryo expressing membrane-bound RFP (memRFP). (A) Wnt8a-Venus in producing cells and punctate structures in host tissue (arrowheads). (B) Rhod. dextr.-positive, transplanted cells and memRFP-positive cell membranes of the host embryo. (C) Wnt8a-Venus puncta colocalize with the plasma membrane of surrounding host cells (arrowheads). (D–F) Mosaic coexpression of Wnt8a-Venus and RFP-GPI (labeling plasma membrane). Most Wnt8a-Venus puncta do not colocalize with RFP-GPI (arrowheads), some colocalize with filopodia (arrow). RFP-GPI vesicles do not colocalize with Wnt8a-Venus puncta (black arrowhead). Inset shows magnification of filopodia-associated (arrow) and released (arrowhead) Wnt8a puncta. (A,D) Green channel, (B,E) red channel, (C,F) overlay. Scale bars: 20 µm, 10 µm in inset. (G–H) Single frames of confocal time-lapse series on live embryos with mosaic coexpression of Wnt8a-Venus (green) and RFP-GPI (red). (G) A bifurcated filopodia from Wnt8a producing cell containing two Wnt8a puncta at its tips (arrowheads) and a Wnt8a puncta moving from the cell surface into the filopodia (arrow). (H) Two Wnt8a puncta (white and black arrowheads, respectively) are released from a filopodium of a Wnt8a producing cell. Single confocal planes are shown; time is indicated in seconds (s). |
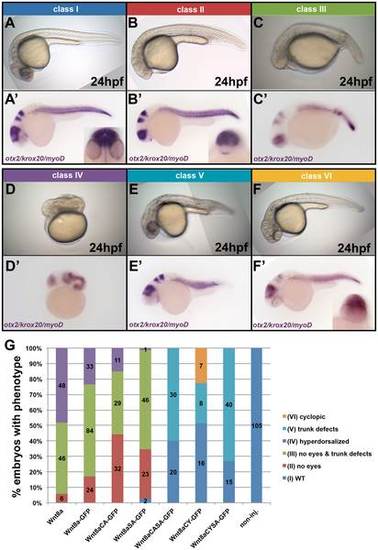
Mutations in Wnt8a affect cell-autonomous neural plate patterning activity. (A–F′) Classes of the phenotypes observed in embryos after overexpression of Wnt8, Wnt8a-GFP or Wnt8a-GFP mutants at 24hpf. (A–F) Live phenotype. (A′–F′) ISH with a probe cocktail including otx2, krox20 and myoD. (G) Distribution of the different phenotype classe upon overexpression of the indicated proteins in percentage. Absolute number of embryos with a given phenotype is shown. Colours correspond to the classes shown in A–F′. |
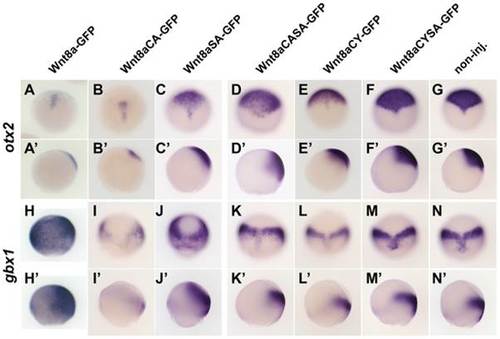
Target gene response to Wnt8a mutant proteins. ISH for otx2 and gbx1 after global overexpression of Wnt8a-GFP mutated for lipidation sites compared to Wnt8a-GFP and non-injected control (A,N′) at 80% epiboly. Wnt8a-GFP represses otx2 (A,A′) and induces gbx1(H,H2). Wnt8aCA-GFP is able to repress otx2 (B,B′) and induce gbx1(I,I′). Wnt8aSA-GFP is able to repress otx (C,C′) and induce gbx1(I,I′). Wnt8aCASA-GFP, WntCYSA-GFP and Wnt8aCY-GFP fail to repress otx2 (D,E,F, respectively) and induce gbx1 (J,K,L, respectively). A–F and G–L are dorsal views, anterior to the top; A2–F2 and G2–H22 are side views, dorsal to the right. EXPRESSION / LABELING:
|
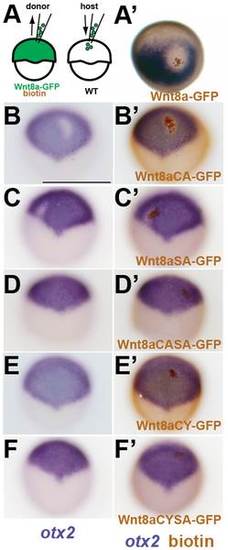
Wnt8a mutations affect cell-non-autonomous neural plate patterning activity. (A) Scheme showing transplantation of cells expressing Wnt8a-GFP or Wnt8a-GFP mutated proteins. (B) Wnt8a-GFP expressing cells (brown) transplanted into a WT embryo at shield stage are able to repress otx2 (blue) in the surrounding neural plate at 80% epiboly stage (2 hours post transplantation. (A′–F′) Expression of otx2 before (B–F′) and after (A′–F′) detection of transplanted cells. Both Wnt8aCA-GFP and Wnt8aSA-GFP are able to repress otx2 (B,C) but only cell-autonomously. Wnt8aCASA-GFP, Wnt8aCYSA-GFP and Wnt8aCY-GFP expressing cells fail to repress otx2 both non- and cell-autonomously. Orientation is anterior to the to the top (D–F). |
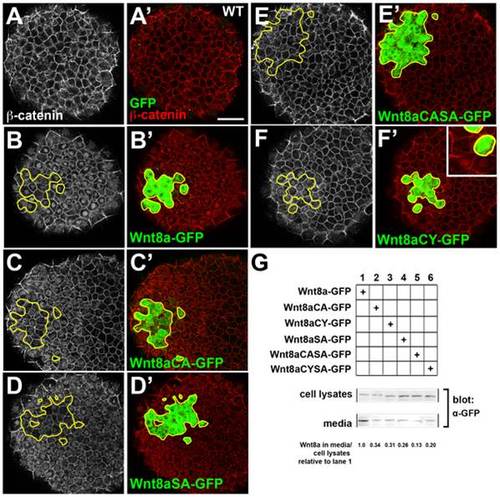
Wnt8a mutations affect cell-non-autonomous activation of β-catenin and secretion. (A–I) Clones of Wnt8a-Venus and Wnt8a-GFP mutants expressing cells transplanted into the animal pole of a WT embryo, fixed one hour after transplantation and stained with anti-GFP (green) and anti β-catenin (red) antibodies. Single confocal sections showing β-catenin is restricted to the membrane in the animal pole of WT embryos (A,A′). Wnt8a-GFP, Wnt8aCA-GFP and WntSA-GFP transplanted cells (B′–D′) induce a wide-range nuclear translocation of β-catenin in the host embryo (B–D) whereas Wnt8aCASA-GFP transplanted cells (E′) do not induce nuclear β-catenin translocation (E). Wnt8aCY-GFP transplanted cells (F′) induce nuclear translocation of β-catenin (F) only in the clone and in host cells directly adjacent to it (inset in F′). Secretion of mutant Wnt8a-GFP proteins is decreased compared to WT Wnt8a-GFP (G). β-catenin in shown in grey (A–F), GFP (green) and β-catenin (red) staining is shown merged (A′–F′). Scale bars: 50 µm. |
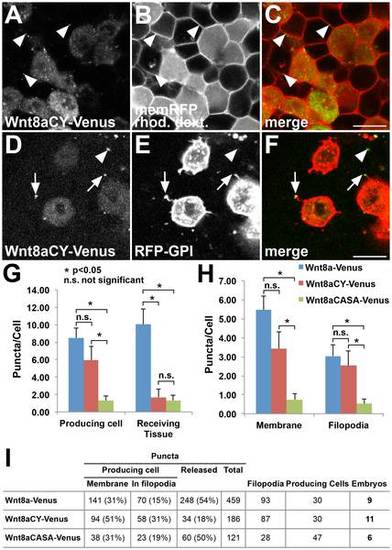
Non-functional Wnt8a mutations have distinct effects on Wnt8a distribution. (A–C) Wnt8aCY-Venus expressing cells colabeled with rhodamine dextran transplanted into a host embryo expressing memRFP. (A) Wnt8aCY-Venus in the expressing cells produce less punctate structures (compare to Fig.1A–C) which nevertheless colocalize with the plasma membrane of receiving cells (arrowheads). (D–F) Mosaic coexpression of Wnt8aCY-Venus and RFP-GPI. The majority of Wnt8aCY-Venus puncta colocalize with filopodia of producing cells (arrow). Only few Wnt8aCY-Venus puncta in the receiving tissue are observed (arrowheads). (G–H) Quantification of the number of puncta in producing cells and in receiving tissue, number of puncta in membrane and in filopodia for Wnt8a-Venus, Wnt8aCY-Venus and Wnt8aCASA-Venus (n = 9 embryos for Wn8-Venus, n = 11 embryos for Wn8-VenusCY, n = 6 embryos for Wnt8aCASA-Venus, error bars represent s.e.m., *p<0.05, n.s. not significant). The number of puncta was normalized to the number of producing cells (labeled with RFG-GPI) in each image. (I) Total numbers for the different parameters analyzed in the quantifications. Producing cells number refers to the sum of RFP-GPI labeled cells in the total number of embryos. (A,D) Green channel, (B,E) red channel, (C,F) overlay. Scale bars: 20 µm. Single confocal planes are shown. |
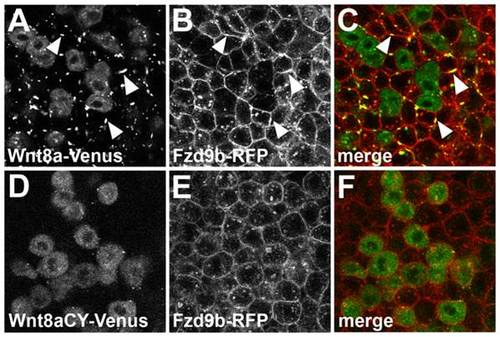
Non-function of Wnt8a results from impaired interaction with its receptor in the target tissue. Single confocal section showing a mosaic expression of Wnt8a-Venus (A–C) or Wnt8aCY-Venus (D–E) in embryos injected with Fzd9b-mRFP mRNA. Co-expression of Wnt8a-Venus and Fzd9b-mRFP induces the formation of membrane clusters which contain both proteins (arrowheads in A–C). Cluster formation is not observed after co-expression of Wnt8aCY-Venus with Fzd9b-mRFP (D-E). (A,D) Green channel, (B,E) red channel, (C,F) overlay. |
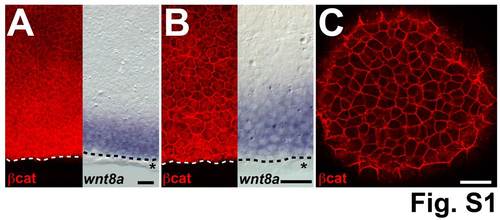
β-catenin protein has graded expression in the blastoderm margin. Comparison of β-catenin staining and wnt8a ISH of shield stage embryos. (A) β-catenin staining intensity decreases from the margin towards the animal pole (left) but is not restricted to the wnt8a mRNA expression domain (right). (B) High magnification shows nuclear β-catenin staining at the margin and decreasing intensity from the margin towards the animal pole (left) but clearly detectable anteriorly (towards the animal pole) to the wnt8a mRNA expression domain (right). (C) β-catenin staining in the animal pole is restricted to the membrane. Dashed line indicates the blastoderm margin, * indicates a row of EVL cells. A and B are representative images of different embryos, at 90° from the shield. Scale bars: 50 µm. |
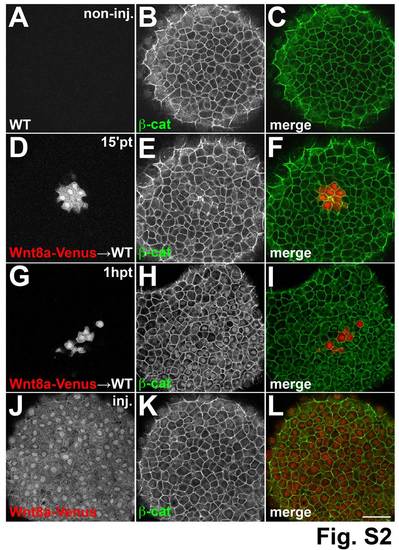
Time dependent β-catenin response to Wnt8a. Single confocal sections at the animal pole of shield stage embryos stained with an antibody against β-catenin. (A–C) β-catenin staining is restricted to the membrane in a WT embryo. (D–I) Cells derived from embryos injected with a lineage tracer (red) and wnt8a-venus mRNA transplanted into WT host embryos. In embryos fixed 15 minutes after transplantation nuclear β-catenin is not detected around the transplanted cells (D–E). In embryos fixed 1 hour after transplantation strong nuclear β-catenin is detected around transplanted cells (G–I). Embryos injected with a lineage tracer (red) and wnt8a-venus RNA at the one-cell stage have no nuclear β-catenin (J-L). (A,D) Red channel, (B,E) green channel, (C,F) overlay. Scale bars: 50 µm. |