
|
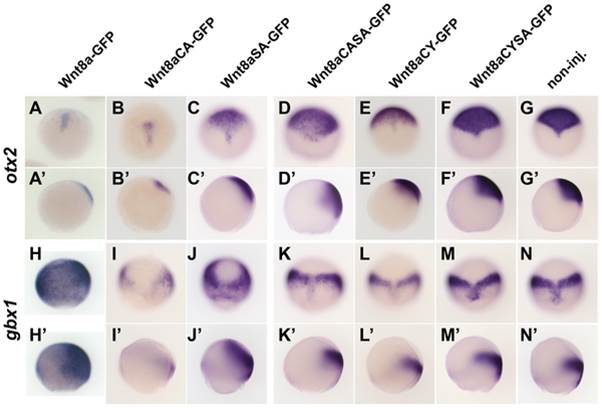
Fig. 4
Target gene response to Wnt8a mutant proteins.
ISH for otx2 and gbx1 after global overexpression of Wnt8a-GFP mutated for lipidation sites compared to Wnt8a-GFP and non-injected control (A,N′) at 80% epiboly. Wnt8a-GFP represses otx2 (A,A′) and induces gbx1(H,H2). Wnt8aCA-GFP is able to repress otx2 (B,B′) and induce gbx1(I,I′). Wnt8aSA-GFP is able to repress otx (C,C′) and induce gbx1(I,I′). Wnt8aCASA-GFP, WntCYSA-GFP and Wnt8aCY-GFP fail to repress otx2 (D,E,F, respectively) and induce gbx1 (J,K,L, respectively). A–F and G–L are dorsal views, anterior to the top; A2–F2 and G2–H22 are side views, dorsal to the right.