
Image
|
Figure Caption
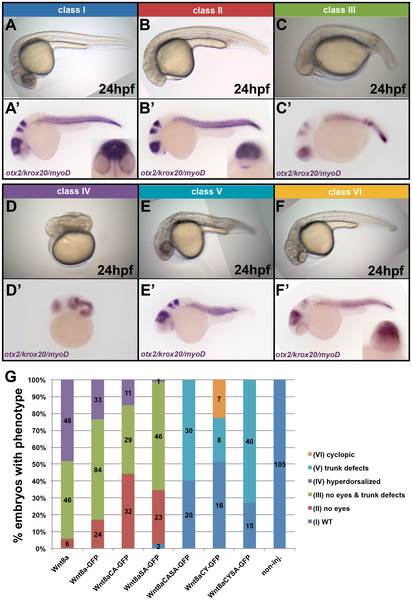
Fig. 3
Mutations in Wnt8a affect cell-autonomous neural plate patterning activity.
(A–F′) Classes of the phenotypes observed in embryos after overexpression of Wnt8, Wnt8a-GFP or Wnt8a-GFP mutants at 24hpf. (A–F) Live phenotype. (A′–F′) ISH with a probe cocktail including otx2, krox20 and myoD. (G) Distribution of the different phenotype classe upon overexpression of the indicated proteins in percentage. Absolute number of embryos with a given phenotype is shown. Colours correspond to the classes shown in A–F′.
Acknowledgments
This image is the copyrighted work of the attributed author or publisher, and
ZFIN has permission only to display this image to its users.
Additional permissions should be obtained from the applicable author or publisher of the image.
Full text @ PLoS One