
- Title
-
Functional redundancy between Cdc14 phosphatases in zebrafish ciliogenesis
- Authors
- Clément, A., Solnica-Krezel, L., and Gould, K.L.
- Source
- Full text @ Dev. Dyn.
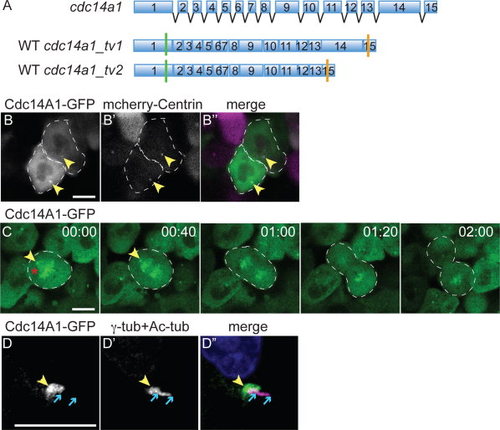
Dynamic distribution of Cdc14A1 during the cell cycle at 8 hpf. A: Structure of cdc14a1 gene and wild-type (WT) transcripts. Green bars indicate translation start codons and orange bars indicate in frame stop codons. B-D: Localization of Cdc14A1 in the ectoderm of live embryos at 8 hpf (B,C) and fixed embryos at 14 hpf (D). B: The embryo was injected with synthetic cdc14a1_tv1-GFP (B, green in B′′) and mcherry-centrin (B′, purple in B′′) RNAs. Dashed lines delimit two cells in interphase. C: Dividing cell proceeding through metaphase (00:00), anaphase (00:40-01:20), and telophase (2:00). Dashed lines delimit the mitotic cell. D: The embryo was injected with synthetic cdc14a1_tv1-GFP RNA and stained using antibodies against GFP (D, green in D′′), γ-tubulin and acetylated tubulin (D′, purple in D′′). Yellow arrowheads point to the centrosomes. Red asterisk indicates the mitotic spindle. Blue arrows delimit the ends of the cilium. Scale bars = 10 μm. |
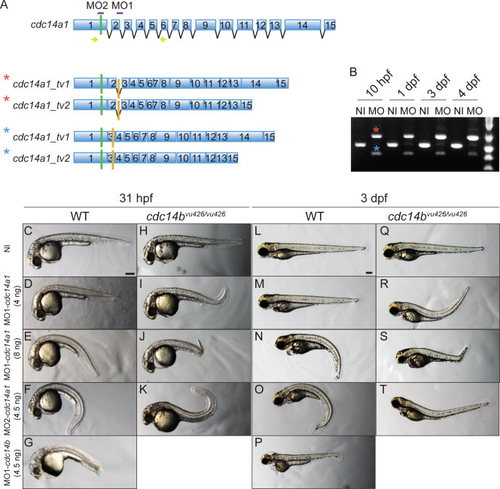
Characterization of cdc14a1 morphological phenotype. A: Structure of cdc14a1 gene and aberrant transcripts. Green bars indicate translation start codons and orange bars indicate in frame stop codons. The sequence targeted by each cdc14a1 MO is indicated in purple. Yellow arrows indicate the sequence of the primers used for RT-PCR in B. B: Efficiency of 8 ng MO1-cdc14a1 over time by RT-PCR. C–T: Comparison of morphological phenotypes between non-injected and MO1-cdc14a1 injected embryos. C,L: Non-injected (NI) wild-type (WT) embryos; H,Q: non-injected cdc14bvu426/426 homozygous mutant embryos; D,E,M,N: wild-type embryos injected at the one-cell stage with MO1-cdc14a1; F,O: wild-type embryos injected at the one-cell stage with MO2-cdc14a1; G,P: wild-type embryos injected at the one-cell stage with MO1-cdc14b; I,J,R,S: cdc14bvu426/426 homozygous mutant embryos injected at the one-cell stage with MO1-cdc14a1; K,T: cdc14bvu426/426 homozygous mutant embryos injected at the one-cell stage with MO2-cdc14a1; C-K: embryos at 31 hpf; L-T: embryos at 3 dpf. Scale bar = 100 μm. PHENOTYPE:
|
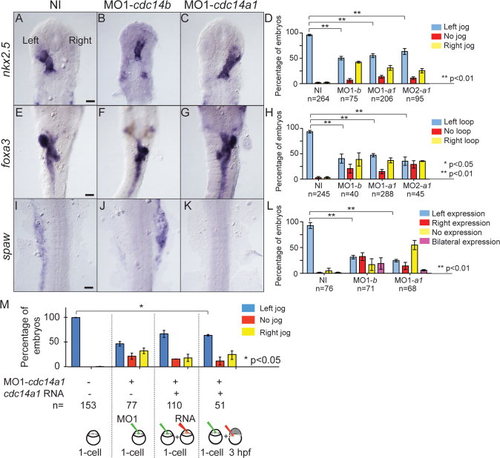
Effect of Cdc14A1 loss of function in LR asymmetry establishment. ISH and expression pattern quantification in non-injected, cdc14a1 and cdc14b MO- injected embryos. A-D: nkx2.5 expression at 31 hpf. E–H: foxa3 expression at 50 hpf. I-L: spaw expression at 19 hpf. Scale bar = 100 μm. M: Rescue of LR asymmetry defect in Cdc14A1-depleted embryos. Heart tube shifting was determined at 31 hpf. Numbers of embryos analyzed are indicated. Data are represented as mean ± SEM. Statistics were done using Student′s t-Test (D,H,L) and are only presented for the left-sided heart tube class in M. EXPRESSION / LABELING:
PHENOTYPE:
|
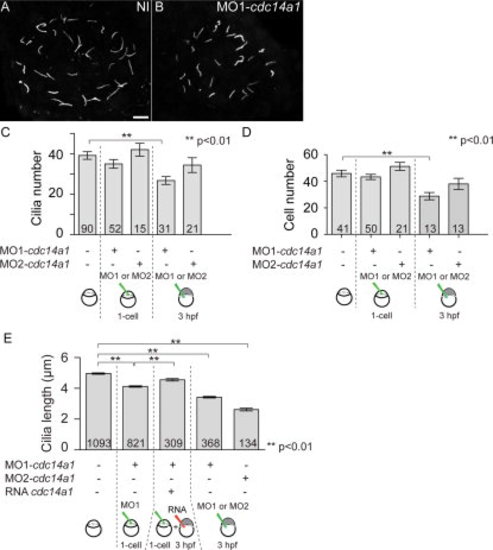
Effect of Cdc14A1 in KV ciliogenesis. A,B: Cilia in the KV at 14 hpf visualized with an anti-acetylated-tubulin antibody. Scale bar = 10 μm. C: Cilia number was determined at 14 hpf. D: The number of cells in the KV was determined at 14 hpf. E: Cilia length was measured at 14 hpf. The numbers of embryos (C,D) and cilia (E) analyzed are indicated. Data are represented as mean ± SEM. Statistics were done using Student′s t-Test and calculated against the non-injected sample. PHENOTYPE:
|
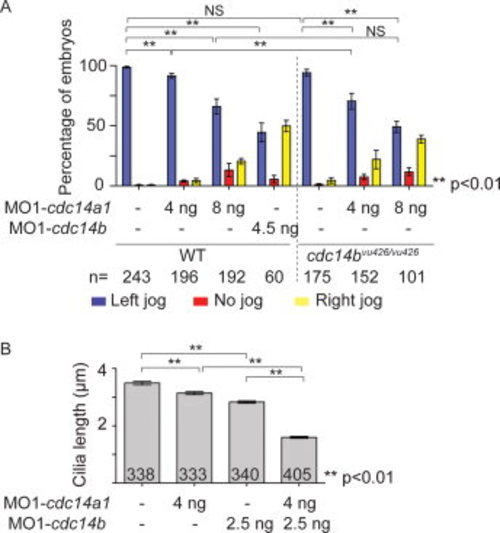
Effect of Cdc14 double loss of function. A: Quantification of heart tube shifting in wild-type (WT) and homozygous cdc14bvu426/426 mutant embryos non-injected or injected with 4 ng MO1-cdc14a1, 8 ng MO1-cdc14a1, or 4.5 ng MO1-cdc14b, at 31 hpf. B: Cilia length was measured at 14 hpf. The numbers of embryos (A) and cilia (B) analyzed are indicated. Data are represented as mean ± SEM. Statistics were done using Student′s t-Test and are only presented for the left-sided heart tube class in A. PHENOTYPE:
|
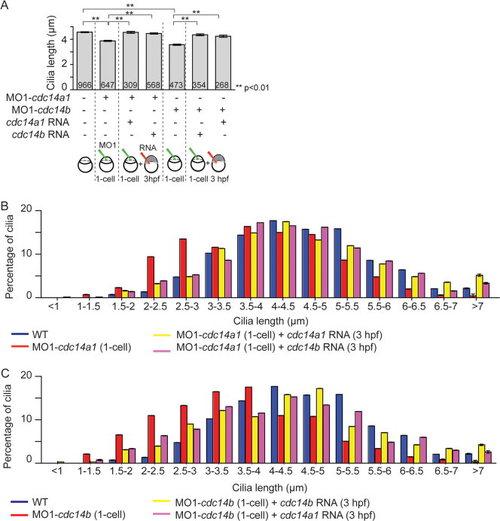
Functional redundancy between Cdc14 proteins. A: Rescue of KV cilia length in cdc14a1 or cdc14b morphant embryos by cdc14a1 or cdc14b RNAs, at 14 hpf. The numbers of cilia analyzed are indicated. Data are represented as mean ± SEM. Statistics were done using Student′s t-Test. B: Graphic representation of the distribution of KV cilia length from (A) in non-injected control, cdc14a1 morphant, and rescued cdc14a1 morphant embryos. C: Graphic representation of the distribution of KV cilia length from A in non-injected control, cdc14b morphant, and rescued cdc14b morphant embryos. PHENOTYPE:
|
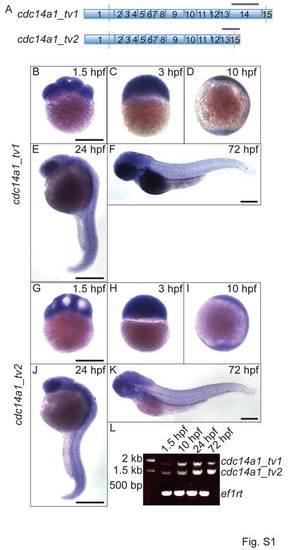
Expression of cdc14a1. A: Sequences targeted by cdc14a1 transcript specific probes (purple bars). B-F: In situ hybridization of cdc14a1_tv1. G-K: In situ hybridization of cdc14a1_tv2. Scale bar =500 μm. L: Temporal expression of cdc14a1_tv1 and cdc14a1_tv2 by RT-PCR. EXPRESSION / LABELING:
|
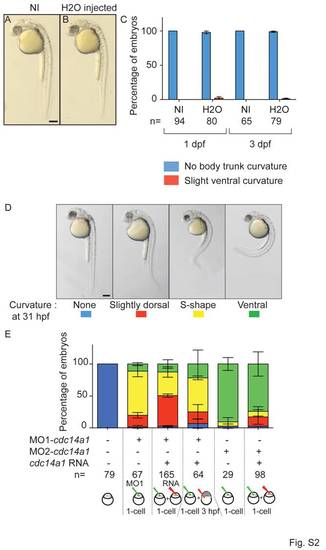
Control of injection procedure. A,B: Comparison of morphological phenotypes between non-injected (NI) (A) and H2O-injected (B) embryos at 31 hpf. C: Quantification of body trunk curvature at 1 dpf and 3 dpf. D,E: Rescue of body curvature at 31 hpf. Body shape phenotype (D) and quantification (E). Scale bar = 100 μm. The numbers of embryos analyzed are indicated. Data are represented as mean ± SEM. Statistics were done using Student′s t-Test. |
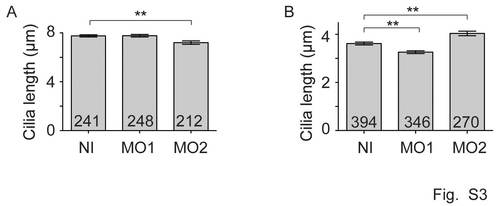
Effect of Cdc14A1 loss of function on kidney cilia and inner ear kinocilia. A: Cilia length in the posterior kidney duct was determined at 31 hpf. B: Cilia length in the posterior macula of inner ear at 5 dpf. The numbers of cilia analyzed are indicated. Data are represented as mean ± SEM. Statistics were done using Student′s t-Test. |