
IMAGE
Fig. S2
- ID
- ZDB-IMAGE-130109-14
- Publication
- Clément et al., 2012 - Functional redundancy between Cdc14 phosphatases in zebrafish ciliogenesis
- All Figures
- Figures for Clément et al., 2012
Image
|
Figure Caption
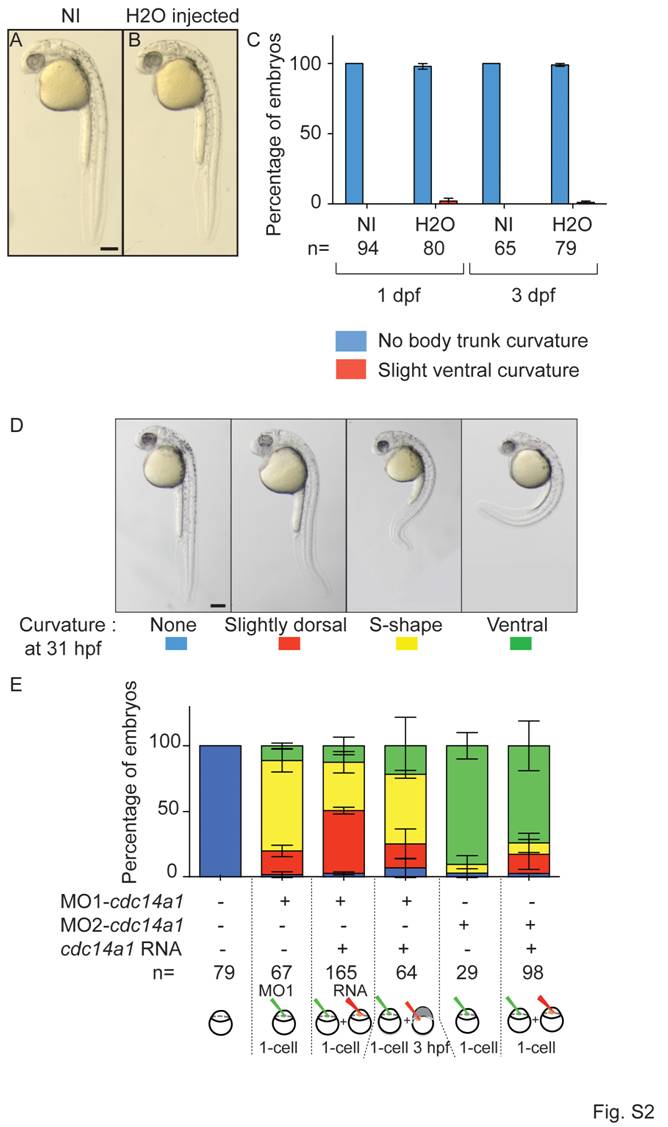
Fig. S2 Control of injection procedure. A,B: Comparison of morphological phenotypes between non-injected (NI) (A) and H2O-injected (B) embryos at 31 hpf. C: Quantification of body trunk curvature at 1 dpf and 3 dpf. D,E: Rescue of body curvature at 31 hpf. Body shape phenotype (D) and quantification (E). Scale bar = 100 μm. The numbers of embryos analyzed are indicated. Data are represented as mean ± SEM. Statistics were done using Student′s t-Test.
Acknowledgments
This image is the copyrighted work of the attributed author or publisher, and
ZFIN has permission only to display this image to its users.
Additional permissions should be obtained from the applicable author or publisher of the image.
Full text @ Dev. Dyn.