
Fig. 2
- ID
- ZDB-IMAGE-130109-16
- Publication
- Clément et al., 2012 - Functional redundancy between Cdc14 phosphatases in zebrafish ciliogenesis
- All Figures
- Figures for Clément et al., 2012
|
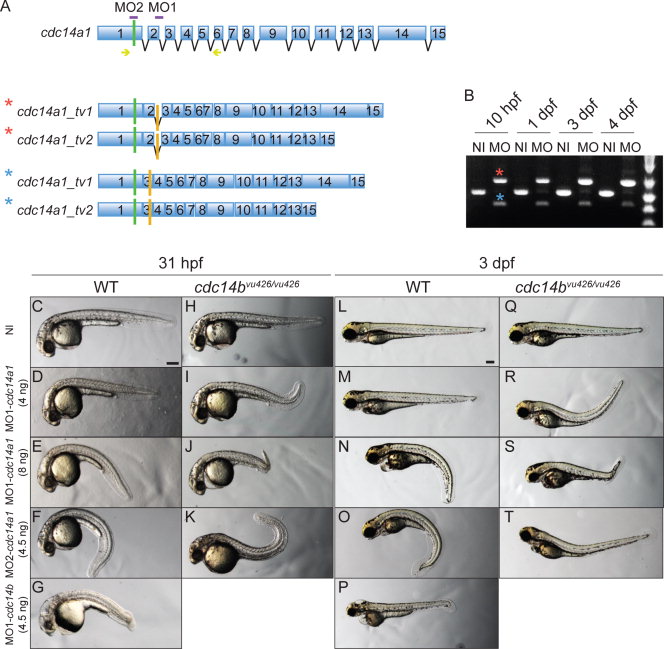
Fig. 2 Characterization of cdc14a1 morphological phenotype. A: Structure of cdc14a1 gene and aberrant transcripts. Green bars indicate translation start codons and orange bars indicate in frame stop codons. The sequence targeted by each cdc14a1 MO is indicated in purple. Yellow arrows indicate the sequence of the primers used for RT-PCR in B. B: Efficiency of 8 ng MO1-cdc14a1 over time by RT-PCR. C–T: Comparison of morphological phenotypes between non-injected and MO1-cdc14a1 injected embryos. C,L: Non-injected (NI) wild-type (WT) embryos; H,Q: non-injected cdc14bvu426/426 homozygous mutant embryos; D,E,M,N: wild-type embryos injected at the one-cell stage with MO1-cdc14a1; F,O: wild-type embryos injected at the one-cell stage with MO2-cdc14a1; G,P: wild-type embryos injected at the one-cell stage with MO1-cdc14b; I,J,R,S: cdc14bvu426/426 homozygous mutant embryos injected at the one-cell stage with MO1-cdc14a1; K,T: cdc14bvu426/426 homozygous mutant embryos injected at the one-cell stage with MO2-cdc14a1; C-K: embryos at 31 hpf; L-T: embryos at 3 dpf. Scale bar = 100 μm.