
IMAGE
Fig. 4
- ID
- ZDB-IMAGE-130109-18
- Publication
- Clément et al., 2012 - Functional redundancy between Cdc14 phosphatases in zebrafish ciliogenesis
- All Figures
- Figures for Clément et al., 2012
Image
|
Figure Caption
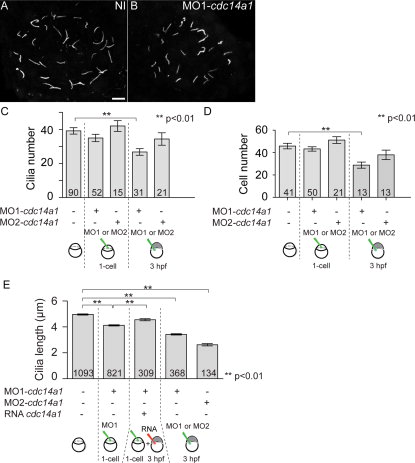
Fig. 4 Effect of Cdc14A1 in KV ciliogenesis. A,B: Cilia in the KV at 14 hpf visualized with an anti-acetylated-tubulin antibody. Scale bar = 10 μm. C: Cilia number was determined at 14 hpf. D: The number of cells in the KV was determined at 14 hpf. E: Cilia length was measured at 14 hpf. The numbers of embryos (C,D) and cilia (E) analyzed are indicated. Data are represented as mean ± SEM. Statistics were done using Student′s t-Test and calculated against the non-injected sample.
Figure Data
Acknowledgments
This image is the copyrighted work of the attributed author or publisher, and
ZFIN has permission only to display this image to its users.
Additional permissions should be obtained from the applicable author or publisher of the image.
Full text @ Dev. Dyn.