
- Title
-
Tumor suppressor Lzap regulates cell cycle progression, doming, and zebrafish epiboly
- Authors
- Liu, D., Wang, W.D., Melville, D.B., Cha, Y.I., Yin, Z., Issaeva, N., Knapik, E.W., and Yarbrough, W.G.
- Source
- Full text @ Dev. Dyn.
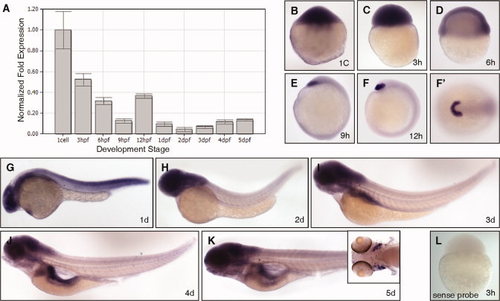
lzap is expressed during epiboly and organogenesis. A: Relative expression of lzap mRNA in developing fish embryos. lzap expression was determined by quantitative reverse transcriptase-polymerase chain reaction (qRT-PCR) at indicated developmental stages and normalized to β-actin expression. hpf, hours postfertilization; dpf, days postfertilization. B–K: Representative photographs of lzap expression during development as determined by in situ hybridization. Embryos are depicted in lateral view, except for the animal pole view shown in F′. B–D: Ubiquitous expression of maternal lzap was detected throughout cleavage stages (B,C) and expression was maintained into early epiboly (D). E,F: After epiboly from 9–12 hpf, lzap expression was concentrated in the precordal plate and areas corresponding to the future hatching gland. G,H: At 1 days post fertilization (dpf) to 2 dpf lzap expression was more intense in the central nervous system (CNS), eye, and pharyngeal region. I: lzap staining was visible in the developing pharynx region, pharyngeal arches and in the primordial of the gastrointestinal organs at 3 dpf. J,K: lzap mRNA was detected at 4–5 dpf (J,K) in the pancreas and gastrointestinal tube, jaw and pharynx region, tectum, gills (see inset, K), and the hindbrain regions. L: Negative control with sense probe at 3 hpf reveals no staining. |

Morpholino-mediated depletion of Lzap results in cleavage stage and epiboly defects. A: Schematic representation of lzap RNAs. lzap:3HA contains the 5′ untranslated region (UTR) sequence targeted by the lzap morpholino (MO) and was used to confirm MO effectiveness. lzap:CDs contains the entire lzap coding sequence but lacks the MO target sequence and was used for rescue. B: Verification of on-target and dose-dependent effects of lzap MO on exogenous Lzap expression. Embryos were injected with lzap:3HA singly or with increasing amounts of lzap MO visualized by immunofluorescence 4 hours postfertilization (hpf). No immunofluorescence was observed in control embryos lacking the primary antibody (data not shown). C: Schematic showing incidence of developmental defects and nonviable embryos at indicated time points following injection of lzap MO, control MO or in embryos without injection. D–E′′: lzap specific MO or control was injected and viability and morphology determined by microscopic visualization at indicated times. Results were compared with uninjected embryos. D–H: Lateral view of uninjected embryos from 3–24 hpf. D′–H′,D′′–E′′: Lateral view of lzap MO injected embryos. Embryos were time matched to uninjected embryos. Arrows indicate persistence of the syncytial layer. Mild and severe phenotypes following injection of lzap MO are shown. |
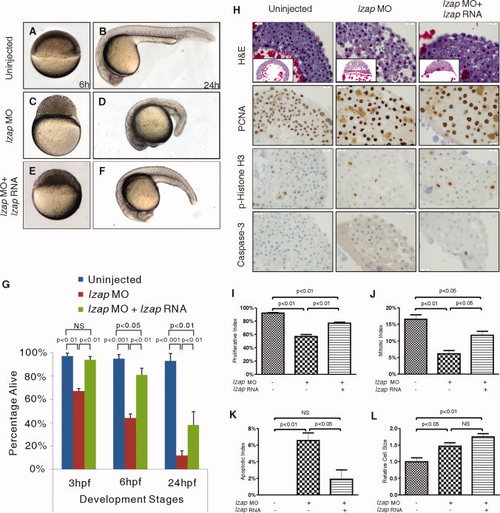
Cleavage stage and epiboly defects in lzap morphants are rescued by co-injection of lzap mRNA. A–F: Co-injection of lzap mRNA with 5′ untranslated region (UTR) morpholino (MO) partially rescued developmental defects of lzap morphants at 6 and 24 hours postfertilization (hpf). G: Schematic showing embryo viability at indicated time points following injection of lzap MO with or without lzap RNA and in embryos without injection. Data represent means and standard errors derived from more than 180 embryos from three independent experiments. H: lzap morphants display proliferative, mitotic, and apoptotic defects that are partially rescued through co-injection of lzap mRNA. Embryos were analyzed at 6 hpf by immunohistochemical staining using antibodies to PCNA, p-Histone H3, and cleaved Caspase-3 as indicated (original magnification, ×40). I–L: Indices for proliferation (I), mitosis (J), and apoptosis (K) were determined by dividing the number of cells staining for PCNA, p-Histone H3, or cleaved Caspase-3, respectively, by the total number of cells. Means and standard error are presented. Data are from sections of 20 independently injected embryos. For relative cell size determination, cell borders were marked on captured hematoxylin stained images and relative area (L) calculated by ImageJ software. Values are normalized to control cells. NS, not significant. |
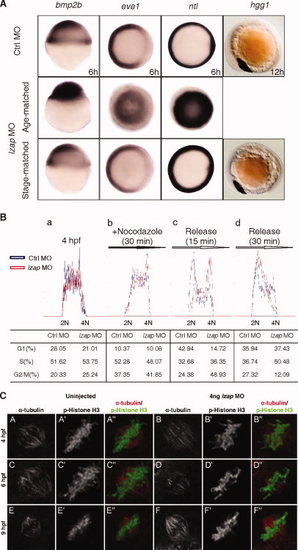
Depletion of Lzap causes delay in cell cycle progression but does not disrupt zygotic gene expression after midblastula transition (MBT). A: The expression of bmp2b, eve1, ntl, and hgg1 in control and both age-matched and stage-matched lzap morphant embryos were detected by whole-mount in situ hybridization. bmp2b expression, lateral view, 6 hours postfertilization (hpf) in control. eve1 and ntl expression, top view, 6 hpf in control. hgg1 expression, lateral view, 12 hpf in control. B: Cell cycle analyses of dissociated zebrafish embryonic cells. DNA content was determine on untreated embryonic cells (a), on cells treated with 10 μg/ml nocodazole for 30 min (b), or on cells treated with nocodazole followed by release for 15 (c) or 30 min (d). Cells were assigned to G1, S, or G2/M based on fluorescent signal and manual gating using CellQuest Pro software. Results in the table represent the mean of at least three independent experiments. C: Embryos with and without injection of 4 ng of lzap morpholino (MO) were co-immunostained with anti–α-tubulin (red) and p-Histone H3 (green) antibodies at 4, 6, and 9 hpf in mitotic cells. Results are representative of observations from more than 100 nuclei for each panel. EXPRESSION / LABELING:
PHENOTYPE:
|
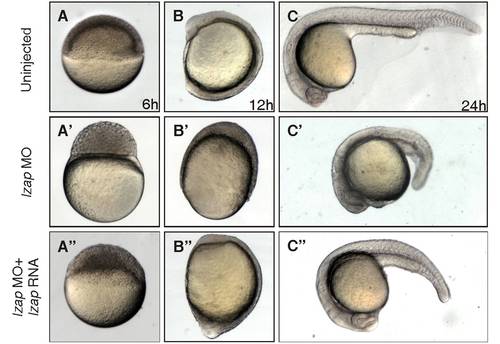
lzap mRNA rescues thelzap morphant phenotype. Live images of embryos at 6, 12, and 24 hours postfertilization (hpf). |
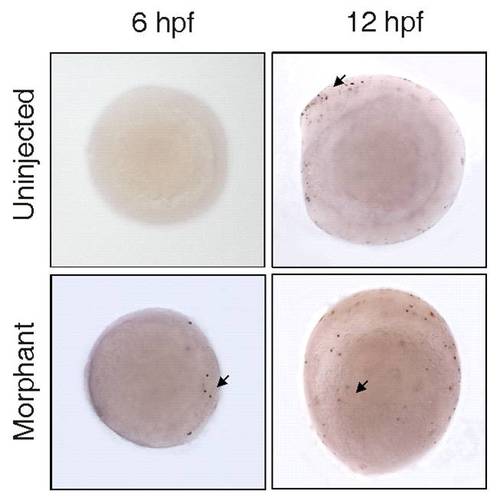
Apoptosis is observed in 6 and 12 hours postfertilization (hpf)lzap morphants. TUNEL (terminal deoxynucleotidyl transferase–mediated deoxyuridinetriphosphate nick end-labeling) staining was used to identify apoptotic cells (indicated by arrows) at 6 and 12 hpf. Apoptosis was observed in scattered cells within the embryo after lzap depletion, while no apoptosis is detected in uninjected controls. At 12 hpf, apoptotic cells were observed primarily in rostral locations in control embryos, while apoptotic cells were more widely dispersed in lzap morphants. |
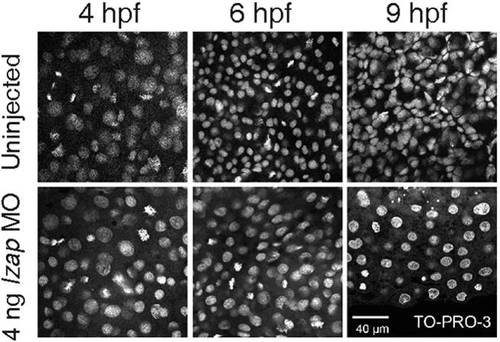
Nuclear morphology is not disrupted in lzap morphants. Confocal images of whole-mount embryos with and without 4 ng of lzap morpholino (MO) were stained with the nuclear marker TO-PRO-3. Pictures represent 4, 6, and 9 hours postfertilization (hpf). Scale bar = 40 μm. PHENOTYPE:
|
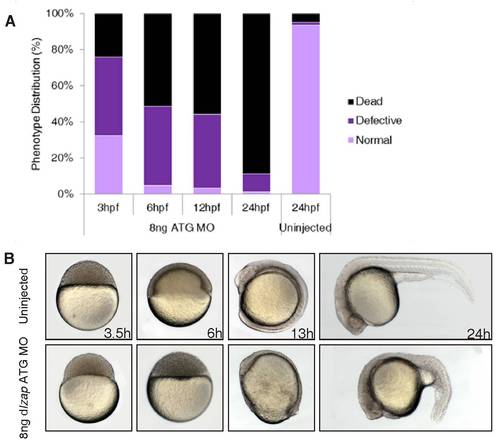
Phenotype of embryos injected with ATG morpholino (MO). A: Quantification of phenotypes at 3.5, 6, 12, and 24 hours postfertilization (hpf). B: Images of control and MO-injected live embryos at 3.5, 6, 13, and 24 hpf. |