
IMAGE
Fig. S5
- ID
- ZDB-IMAGE-110531-15
- Publication
- Liu et al., 2011 - Tumor suppressor Lzap regulates cell cycle progression, doming, and zebrafish epiboly
- All Figures
- Figures for Liu et al., 2011
Image
|
Figure Caption
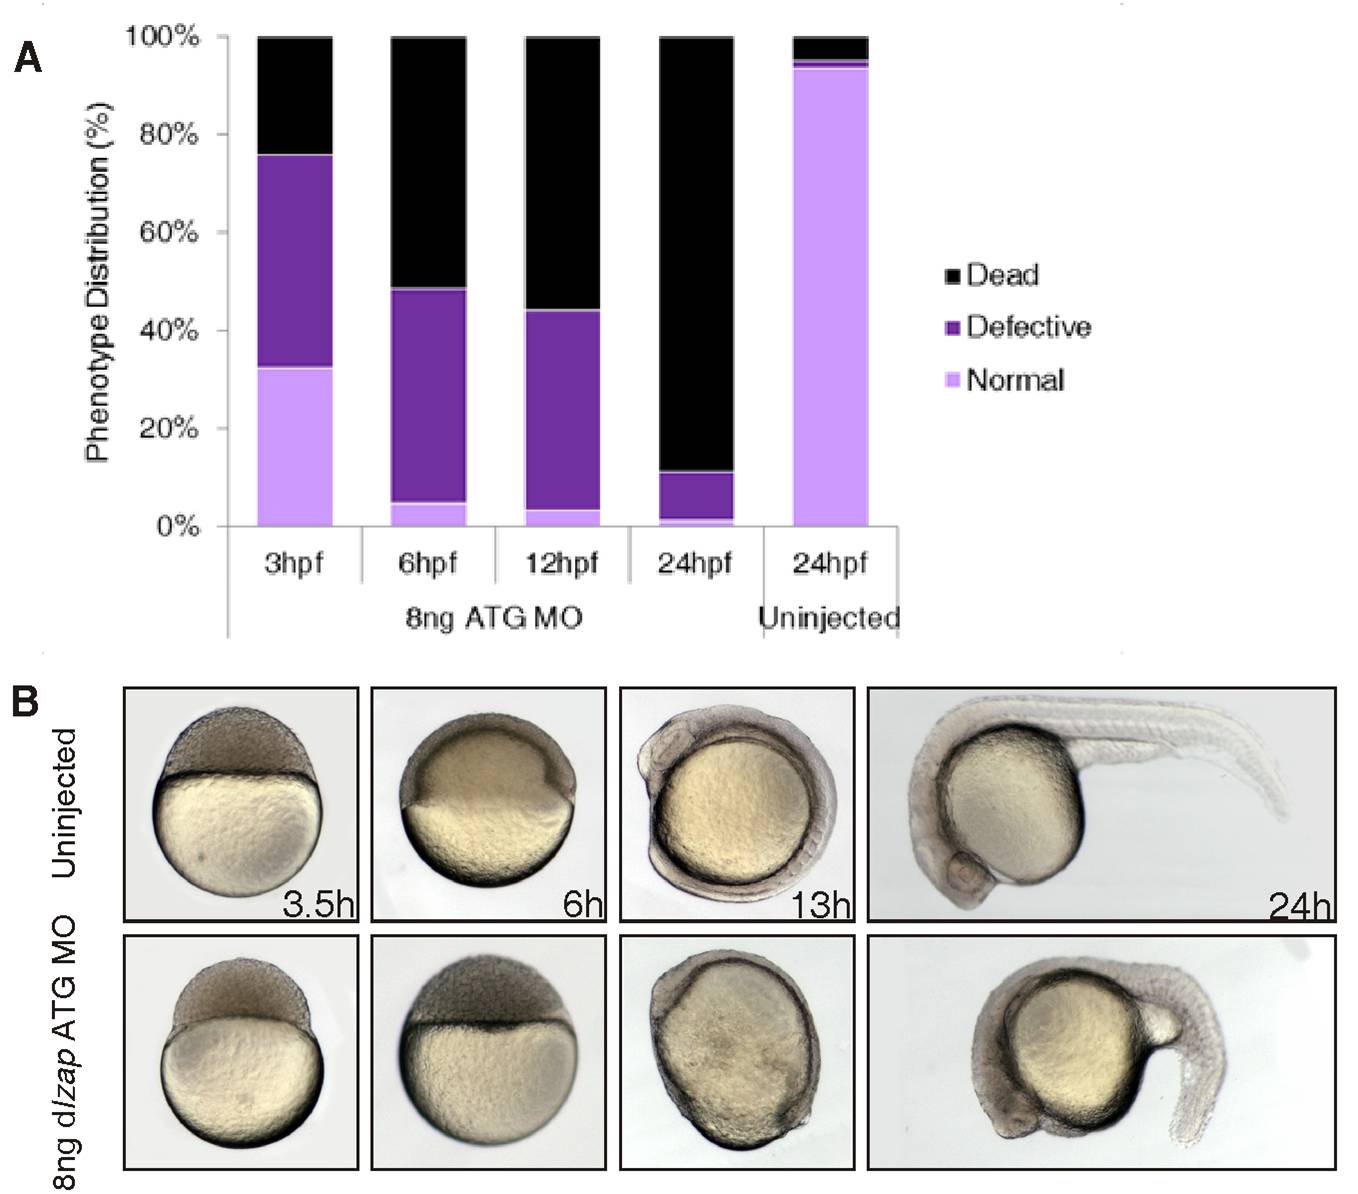
Fig. S5 Phenotype of embryos injected with ATG morpholino (MO). A: Quantification of phenotypes at 3.5, 6, 12, and 24 hours postfertilization (hpf). B: Images of control and MO-injected live embryos at 3.5, 6, 13, and 24 hpf.
Figure Data
Acknowledgments
This image is the copyrighted work of the attributed author or publisher, and
ZFIN has permission only to display this image to its users.
Additional permissions should be obtained from the applicable author or publisher of the image.
Full text @ Dev. Dyn.