
Fig. 2
- ID
- ZDB-IMAGE-110531-8
- Genes
- Publication
- Liu et al., 2011 - Tumor suppressor Lzap regulates cell cycle progression, doming, and zebrafish epiboly
- All Figures
- Figures for Liu et al., 2011
|
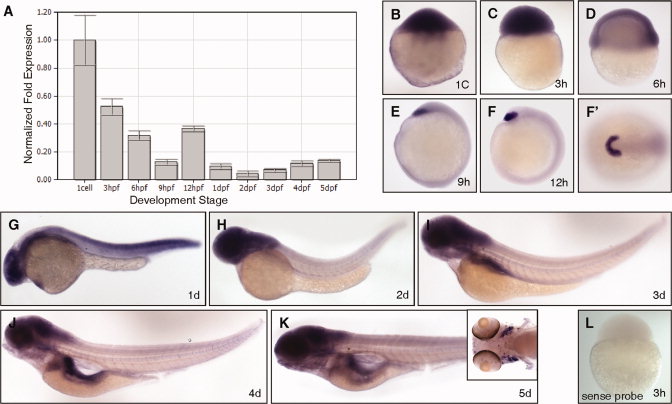
Fig. 2 lzap is expressed during epiboly and organogenesis. A: Relative expression of lzap mRNA in developing fish embryos. lzap expression was determined by quantitative reverse transcriptase-polymerase chain reaction (qRT-PCR) at indicated developmental stages and normalized to β-actin expression. hpf, hours postfertilization; dpf, days postfertilization. B–K: Representative photographs of lzap expression during development as determined by in situ hybridization. Embryos are depicted in lateral view, except for the animal pole view shown in F′. B–D: Ubiquitous expression of maternal lzap was detected throughout cleavage stages (B,C) and expression was maintained into early epiboly (D). E,F: After epiboly from 9–12 hpf, lzap expression was concentrated in the precordal plate and areas corresponding to the future hatching gland. G,H: At 1 days post fertilization (dpf) to 2 dpf lzap expression was more intense in the central nervous system (CNS), eye, and pharyngeal region. I: lzap staining was visible in the developing pharynx region, pharyngeal arches and in the primordial of the gastrointestinal organs at 3 dpf. J,K: lzap mRNA was detected at 4–5 dpf (J,K) in the pancreas and gastrointestinal tube, jaw and pharynx region, tectum, gills (see inset, K), and the hindbrain regions. L: Negative control with sense probe at 3 hpf reveals no staining.