- Title
-
gfap and nestin reporter lines reveal characteristics of neural progenitors in the adult zebrafish brain
- Authors
- Lam, C.S., Maerz, M., and Strähle, U.
- Source
- Full text @ Dev. Dyn.
|
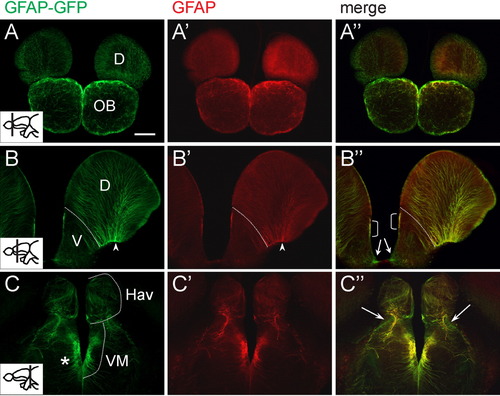
Comparison of tg[GFAP-GFP] and endogenous glial fibrillary acidic protein (GFAP) expression in the forebrain of adult zebrafish. A-C′: Vibratome sections were stained with anti-green fluorescent protein (GFP; A-C) and anti-GFAP (A′-C′) antibodies. A″-C″: The merged channel shows overlapping signals in most regions, except for subtle differences at the periphery of the central nervous system (indicated by arrows). In the dorsal telencephalon, radial fibers coexpressing GFP and GFAP converge at the basal side (arrowhead in B,B′). Dotted line in B,B′ delineates the boundary between the dorsal and ventral telencephalon. Bracketed region in B″ indicate a domain that correlates with previously identified region for fast-proliferating cells. Asterisk in C shows GFP- and GFAP-positive radial fibers in the diencephalon. Plane of section is indicated in the inset of A-C. Images were acquired with a compound microscope. D, dorsal telencephalic area; Hav, ventral habenular nucleus; OB, olfactory bulb; V, ventral telencephalic area; VM, ventromedial thalamic nucleus. Scale bar = 100 μm. EXPRESSION / LABELING:
|
|
Comparison of tg[-3.9nestin:GFP] expression with endogenous nestin mRNA. Transverse sections were processed for fluorescence in situ hybridization with nestin riboprobe followed by immunohistochemical detection with an anti-green fluorescent protein (GFP) antibody. A-D: Expression of tg[-3.9nestin:GFP] from the anterior to posterior levels of the telencephalon. Inset indicates the plane of section. GFP-labeled processes are reminiscent of radial glial fibers (open arrows). A′-D′: In situ hybridizations on sections shown in A-D with antisense nestin. A″-D″: Colocalization of GFP and nestin mRNA at the ventricular zones (arrows). Certain subventricular areas (arrowheads) express the endogenous nestin mRNA but not the transgene, including a large domain in the ventral telencephalon (asterisks in B″, C″) and in the diencephalic ventricle (asterisk in D″). A′-D′″: Higher magnification of boxed regions in A″-D″. The nestin-expressing cells include those in the ventricular zone (VZ) and in scattered cells of the parenchyma, while GFP-expressing cells with glia-like projections emanate from the VZ. Most of the GFP-expressing cells colocalized with nestin. Images are confocal single optical sections. Scale bars = 100 μm in A, 50 μm in A′″. EXPRESSION / LABELING:
|
|
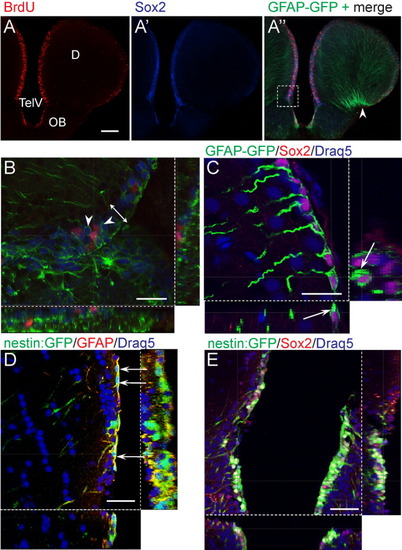
tg[GFAP-GFP] and tg[-3.9nestin:GFP] coexpress Sox2 at the ventricular zone. A-A″: Comparison of the distribution of cells labeled by bromodeoxyuridine (BrdU, red), Sox2 (blue), and glial fibrillary acidic protein- green fluorescent protein (GFAP-GFP, green). The merged channel (A″) shows abundant proliferating and Sox2-expressing cells in the ventricular zone (VZ). Arrowhead indicates the basal side of the telencephalon where GFP-positive radial fibers converge. Images were acquired with a compound microscope. B: High magnification confocal z-section of the boxed area in A″. Sox2-expressing cells occupy an approximately three-cell-layer thick matrix (double arrow) immediately below the ventricular surface, and several cells are enclosed by cytoplasmic GFAP (arrowheads). Some but not all sox2-positive cells incorporated bromodeoxyuridine (BrdU, pink). C: In the dorsal telencephalon, a confocal z-section show that Sox2-expressing (pink) and GFAP-GFP-expressing (green) cells are located immediately below the ventricular surface and are organized as a single layer rather than in multiple layers as in the case of the ventral telencephalon. All nuclei are labeled with the blue stain Draq5 to indicate the ventricular boundary and the Sox2-positive cells (pink) are associated with a long radial process. Note GFAP-GFP surrounding Sox2 positive nuclei (arrows). D: The processes of tg[-3.9nestin:GFP] and GFAP-expressing cells colocalize. Sections were double-immunostained with anti-GFP and -GFAP antibodies followed by nuclear counterstaining with Draq5. Confocal z-section image shows colocalization of both signals in the cytoplasmic processes. In particular, the transgene showing GFAP immunoreactivity can be traced to single soma that line the VZ (arrows). E: tg[-3.9nestin:GFP] cells colocalize with Sox2 at the VZ. Nuclei were labeled with Draq5 (blue). Notably, the matrix of the VZ in the dorsal telencephalon comprises of a thin layer of cells that is marked by Sox2 and nestin:GFP expression. Triple-labeled cells produce a whitish colocalization signal in the nucleus and are surrounded by cytoplasmic GFP. Transverse sections are oriented with dorsal up. Image is a confocal z-section. D, dorsal telencephalic area; TelV, telencephalic ventricle; OB, olfactory bulb. Scale bars = 100 μm in A, 25 μm in B,C, 50 μm in D,E. EXPRESSION / LABELING:
|
|
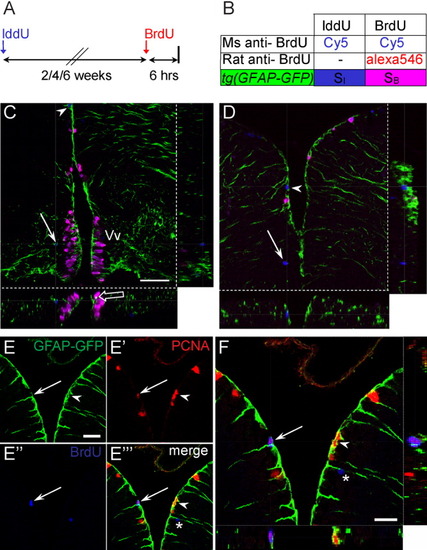
Expression of tg[GFAP-GFP] in fast and slow cycling progenitors. A,B: Summary of experimental strategy to detect proliferating cells. Adult fish were injected with iododeoxyuridine (IddU). After 2, 4, or 6 weeks, fish were injected with bromodeoxyuridine (BrdU) and killed 6 hr later for immunostaining with mouse anti-BrdU antibody (recognizes both IddU and BrdU) and rat anti-BrdU (specific for BrdU only). C,D: Confocal z-sections of triple-labeled cells in the ventral (C) and dorsal (D) telencephalon, showing association of glial fibrillary acidic protein- green fluorescent protein (GFAP-GFP) processes with mitotic cells. Blue cells synthesized DNA during the IddU-labeling phase, whereas pink cells have entered the cell cycle during the 6-hr BrdU labeling before killing. Cells in the ventral telencephalon are characterized by BrdU labeling (pink), suggesting that they have incorporated the label during the final 6 hr of exposure and are fast cycling (open arrow indicate coexpression with GFP). One blue cell is visible at a distance from the ventricular region (arrow, C). In the dorsal telencephalon, long-term IddU-labeled cells (blue) are located at the ventricular boundary and expressed GFAP (arrowheads, C, D). E,F: Confocal optical sections of the dorsal telencephalon show that self-renewing progenitors express GFAP. Section was stained with anti-proliferating cell nuclear antigen (PCNA; red, E′) and anti-BrdU (blue, E″) antibodies to identify self-renewing progenitors (arrows, E-E′″). These cells overlap with GFP+ radial glial fibers when examined under a single optical z-section (arrow, F). PCNA-expressing cells (arrowheads, E-F) are also GFP+ in tg[GFAP-GFP] animals. Asterisk in E′″ and F indicate a recently divided cell that has migrated out of the VZ. Vv, ventral nucleus of ventral telencephalic area. Scale bar = 50 μm in C, 25 μm in E,F. EXPRESSION / LABELING:
|
|
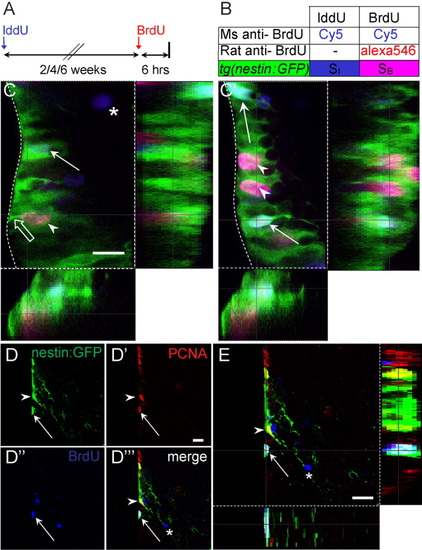
Tg[-3.9nestin:GFP] is expressed in cycling and long-term label retaining cells at the ventricular zone. A,B: Summary of experimental strategy to detect proliferating cells. C,C′: Two confocal z-planes of a single transverse section through the ventral telencephalon of tg[-3.9nestin:GFP]. Iododeoxyuridine (IddU) -labeled cells were left to survive for 4 weeks followed by a pulse of bromodeoxyuridine (BrdU) for 6 hr before killing. Arrowheads indicate colocalization of green fluorescent protein (GFP, green) with fast-cycling BrdU-labeled cells (pink), whereas open arrow shows the endfoot at the ventricular zone (VZ). Arrows and asterisks indicate IddU-labeled cells (blue) that are either GFP-positive or -negative, respectively. Dotted line delineates boundary of the VZ. D-D′″: Confocal images of single and merged channels of tg[-3.9nestin:GFP] positive cells in the ventral telencephalon. There is colocalization of GFP+/proliferating cell nuclear antigen-positive (PCNA+) cells (arrowheads) and GFP+/PCNA+/BrdU+ cells after a 2-week chase period (arrows), indicating that tg[-3.9nestin:GFP] is expressed in cycling cells and progenitors that are capable of self-renewal. Some BrdU+/PCNA- cells have migrated out of the VZ (asterisks) and are likely to be differentiated. E: Single optical z-section clearly reveals a triple stained GFP+/PCNA+/BrdU+ self-renewing progenitor. Scale bar 10 μm in C, 25 μm in D′, E. EXPRESSION / LABELING:
|
|
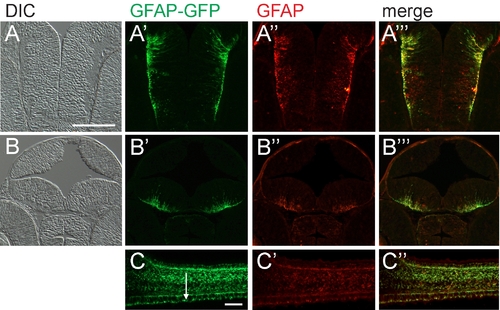
Green fluorescent protein (GFP) expression of embryonic tg(GFAP-GFP) closely resembles endogenous glial fibrillary acidic protein (GFAP). A,B: Transverse cryosections at two levels of the forebrain (differential interference contrast image). A′,B′: tg(GFAP-GFP) transgene expression. A″,B″: Immunohistochemistry with anti-GFAP antibody. A′″,B′″: Merged expression patterns of tg(GFAP-GFP) transgene and endogenous GFAP. C: Sagittal cryosection of the spinal cord of tg(GFAP-GFP). C′: Anti-GFAP antibody staining of the same section. C″: Merged panels showing overlap of the expression patterns of GFAP-GFP and endogenous GFAP. Expression is also detected in the floor plate (arrow). Anterior left and dorsal up. The 48 hours postfertilization (hpf) embryos are shown in A and B and the 42 hpf embryo is in C. Scale bar = 50 μm in A,C. |
|
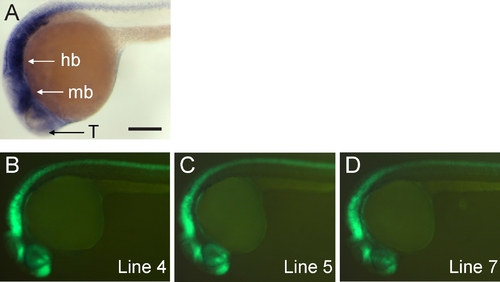
Embryonic expression of zebrafish nestin and tg(-3.9nestin:GFP) transgenic lines. A: Endogenous nestin mRNA expression. B-D: Expression of three stable transgenic lines driven by -3.9 kb of nestin upstream regulatory region. Anterior left, dorsal up. Embryos are 24 hours postfertilization (hpf). Hb, hindbrain; mb, midbrain; T, telencephalon. Scale bar = 250 μm in A. |
|
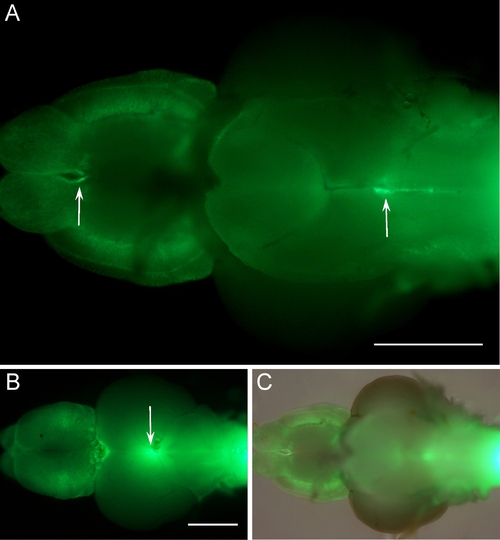
Expression of glial fibrillary acidic protein- green fluorescent protein (GFAP-GFP) on whole-mount brains of adult tg(GFAP-GFP) animals. A-C: Arrows indicate expression in the ventricular zones from the ventral (A,C) and dorsal view (B). C: Merged pictures of the fluorescent signal (B) and a bright field image of the brain. Anterior to the left. Scale bar = 500 μm in A,B. |
|
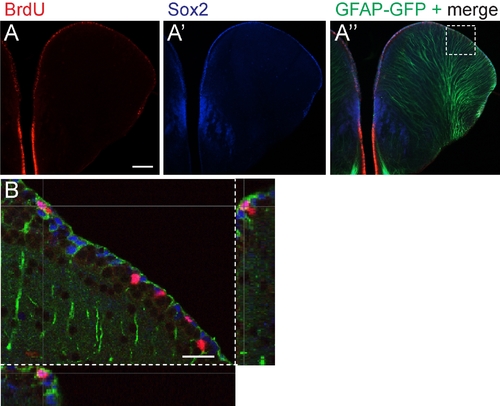
The ventricular zone of the dorsal telencephalon contains mitotically active cells that express Sox 2 and glial fibrillary acidic protein (GFAP). A: Immunohistochemical staining of bromodeoxyuridine (BrdU) incorporation (red) marks mitotically active cells. A′,A″: Immunohistochemical detection of Sox2 (blue) and GFAP- green fluorescent protein (GFAP-GFP, green). A merged image (A″) shows the distribution of BrdU-labeled cells (red) in relation to GFAP and Sox 2. Images A-A″ were acquired from compound microscope. B: A confocal optical z-section, magnified from the boxed region in A″ show a proliferating cell colocalizing with Sox2 and exhibiting GFAP-positive glia processes. Dorsal up. Scale bar = 100 μm in A, 25 μm in B. |

