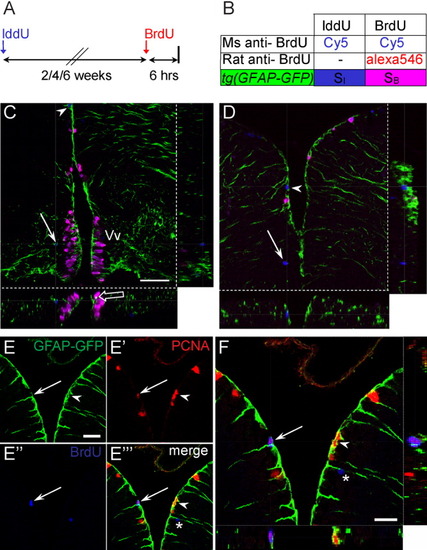
Expression of tg[GFAP-GFP] in fast and slow cycling progenitors. A,B: Summary of experimental strategy to detect proliferating cells. Adult fish were injected with iododeoxyuridine (IddU). After 2, 4, or 6 weeks, fish were injected with bromodeoxyuridine (BrdU) and killed 6 hr later for immunostaining with mouse anti-BrdU antibody (recognizes both IddU and BrdU) and rat anti-BrdU (specific for BrdU only). C,D: Confocal z-sections of triple-labeled cells in the ventral (C) and dorsal (D) telencephalon, showing association of glial fibrillary acidic protein- green fluorescent protein (GFAP-GFP) processes with mitotic cells. Blue cells synthesized DNA during the IddU-labeling phase, whereas pink cells have entered the cell cycle during the 6-hr BrdU labeling before killing. Cells in the ventral telencephalon are characterized by BrdU labeling (pink), suggesting that they have incorporated the label during the final 6 hr of exposure and are fast cycling (open arrow indicate coexpression with GFP). One blue cell is visible at a distance from the ventricular region (arrow, C). In the dorsal telencephalon, long-term IddU-labeled cells (blue) are located at the ventricular boundary and expressed GFAP (arrowheads, C, D). E,F: Confocal optical sections of the dorsal telencephalon show that self-renewing progenitors express GFAP. Section was stained with anti-proliferating cell nuclear antigen (PCNA; red, E′) and anti-BrdU (blue, E″) antibodies to identify self-renewing progenitors (arrows, E-E′″). These cells overlap with GFP+ radial glial fibers when examined under a single optical z-section (arrow, F). PCNA-expressing cells (arrowheads, E-F) are also GFP+ in tg[GFAP-GFP] animals. Asterisk in E′″ and F indicate a recently divided cell that has migrated out of the VZ. Vv, ventral nucleus of ventral telencephalic area. Scale bar = 50 μm in C, 25 μm in E,F.
|
