
Fig. 2
- ID
- ZDB-IMAGE-090224-7
- Genes
- Antibodies
- Publication
- Lam et al., 2009 - gfap and nestin reporter lines reveal characteristics of neural progenitors in the adult zebrafish brain
- All Figures
- Figures for Lam et al., 2009
|
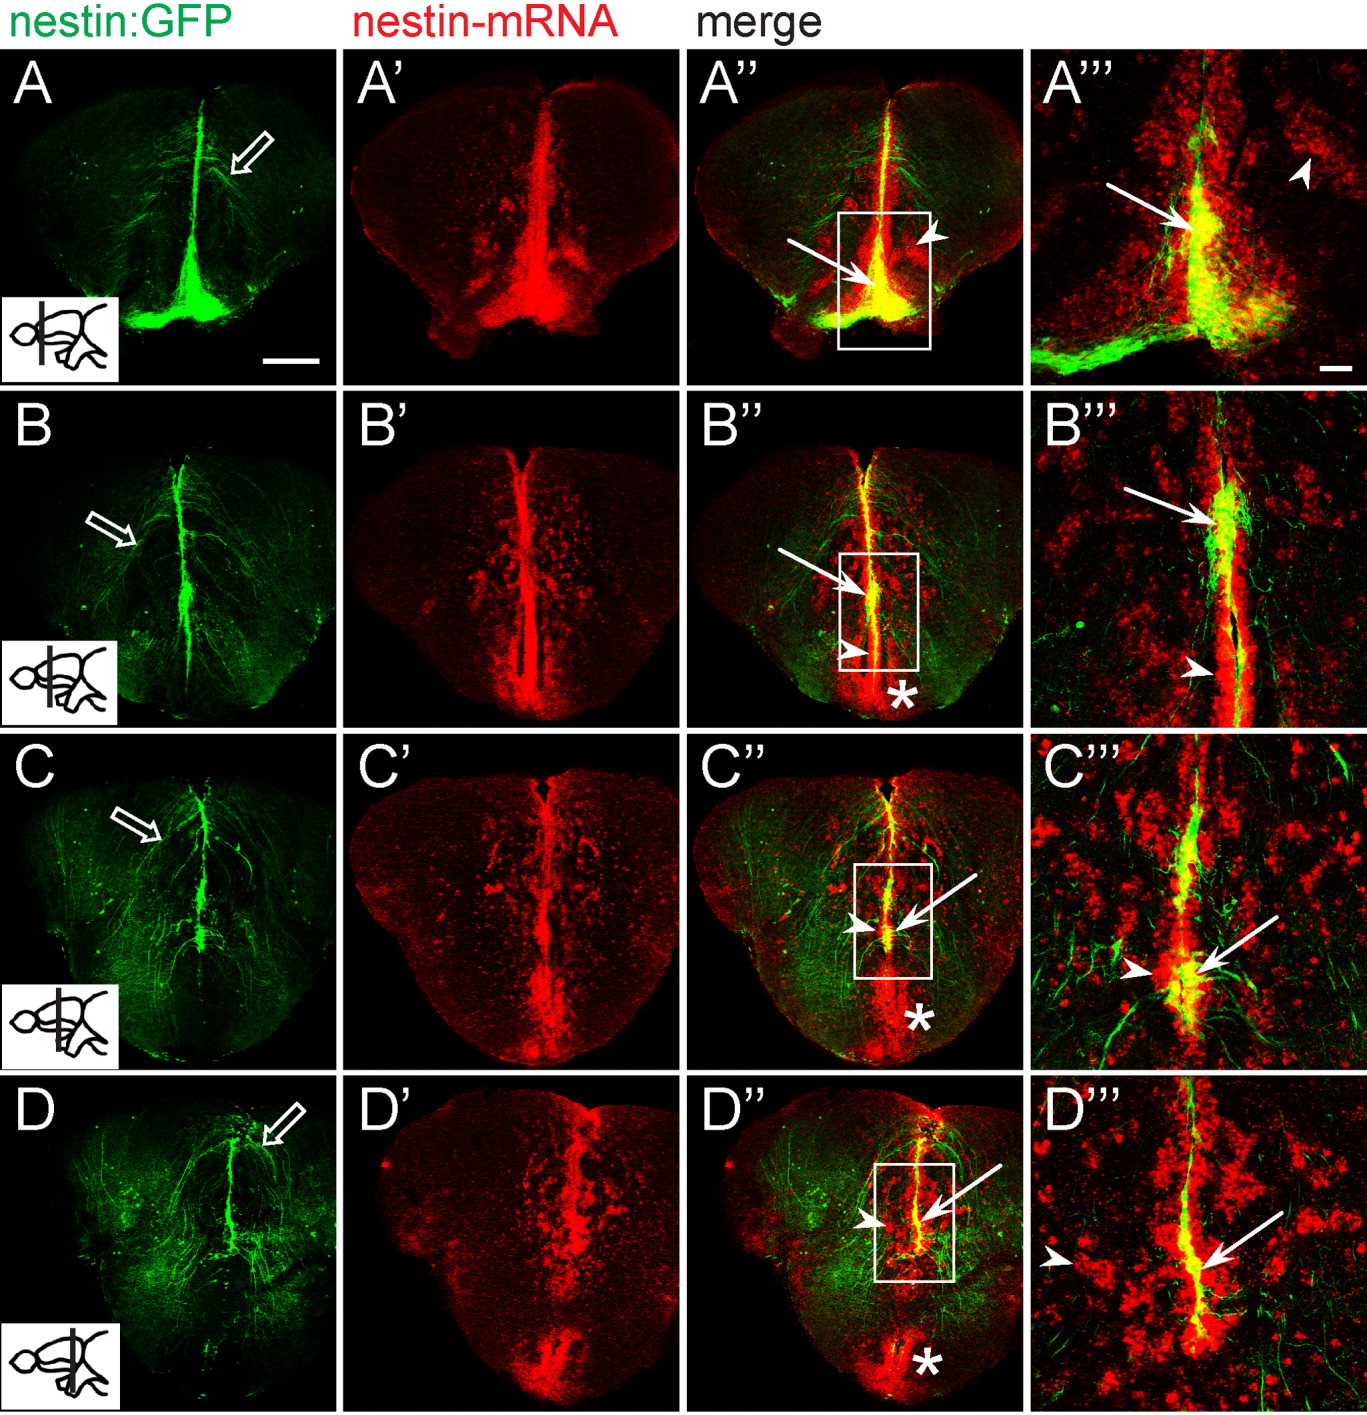
Fig. 2 Comparison of tg[-3.9nestin:GFP] expression with endogenous nestin mRNA. Transverse sections were processed for fluorescence in situ hybridization with nestin riboprobe followed by immunohistochemical detection with an anti-green fluorescent protein (GFP) antibody. A-D: Expression of tg[-3.9nestin:GFP] from the anterior to posterior levels of the telencephalon. Inset indicates the plane of section. GFP-labeled processes are reminiscent of radial glial fibers (open arrows). A′-D′: In situ hybridizations on sections shown in A-D with antisense nestin. A″-D″: Colocalization of GFP and nestin mRNA at the ventricular zones (arrows). Certain subventricular areas (arrowheads) express the endogenous nestin mRNA but not the transgene, including a large domain in the ventral telencephalon (asterisks in B″, C″) and in the diencephalic ventricle (asterisk in D″). A′-D′″: Higher magnification of boxed regions in A″-D″. The nestin-expressing cells include those in the ventricular zone (VZ) and in scattered cells of the parenchyma, while GFP-expressing cells with glia-like projections emanate from the VZ. Most of the GFP-expressing cells colocalized with nestin. Images are confocal single optical sections. Scale bars = 100 μm in A, 50 μm in A′″.