
Fig. 1
- ID
- ZDB-IMAGE-090224-6
- Genes
- Antibodies
- Publication
- Lam et al., 2009 - gfap and nestin reporter lines reveal characteristics of neural progenitors in the adult zebrafish brain
- All Figures
- Figures for Lam et al., 2009
|
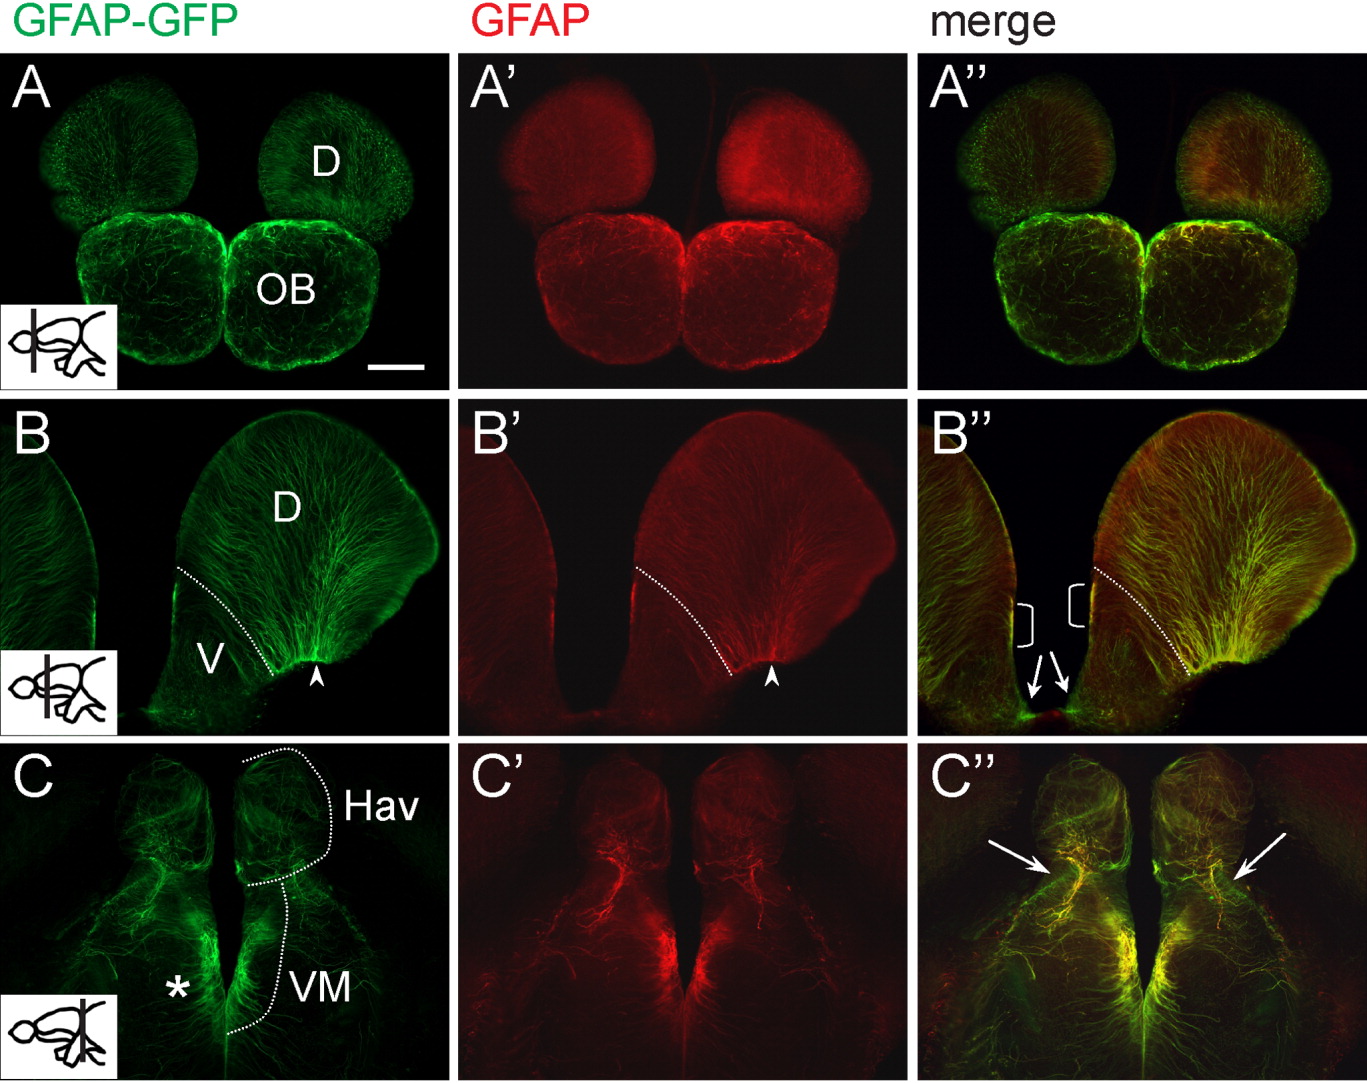
Fig. 1 Comparison of tg[GFAP-GFP] and endogenous glial fibrillary acidic protein (GFAP) expression in the forebrain of adult zebrafish. A-C′: Vibratome sections were stained with anti-green fluorescent protein (GFP; A-C) and anti-GFAP (A′-C′) antibodies. A″-C″: The merged channel shows overlapping signals in most regions, except for subtle differences at the periphery of the central nervous system (indicated by arrows). In the dorsal telencephalon, radial fibers coexpressing GFP and GFAP converge at the basal side (arrowhead in B,B′). Dotted line in B,B′ delineates the boundary between the dorsal and ventral telencephalon. Bracketed region in B″ indicate a domain that correlates with previously identified region for fast-proliferating cells. Asterisk in C shows GFP- and GFAP-positive radial fibers in the diencephalon. Plane of section is indicated in the inset of A-C. Images were acquired with a compound microscope. D, dorsal telencephalic area; Hav, ventral habenular nucleus; OB, olfactory bulb; V, ventral telencephalic area; VM, ventromedial thalamic nucleus. Scale bar = 100 μm.