
Fig. 3
|
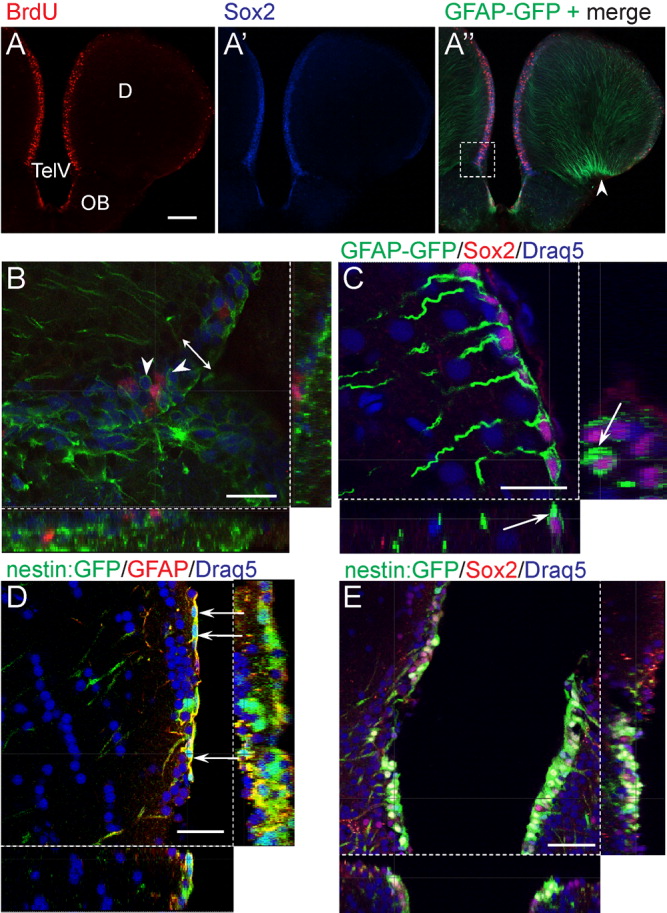
Fig. 3 tg[GFAP-GFP] and tg[-3.9nestin:GFP] coexpress Sox2 at the ventricular zone. A-A″: Comparison of the distribution of cells labeled by bromodeoxyuridine (BrdU, red), Sox2 (blue), and glial fibrillary acidic protein- green fluorescent protein (GFAP-GFP, green). The merged channel (A″) shows abundant proliferating and Sox2-expressing cells in the ventricular zone (VZ). Arrowhead indicates the basal side of the telencephalon where GFP-positive radial fibers converge. Images were acquired with a compound microscope. B: High magnification confocal z-section of the boxed area in A″. Sox2-expressing cells occupy an approximately three-cell-layer thick matrix (double arrow) immediately below the ventricular surface, and several cells are enclosed by cytoplasmic GFAP (arrowheads). Some but not all sox2-positive cells incorporated bromodeoxyuridine (BrdU, pink). C: In the dorsal telencephalon, a confocal z-section show that Sox2-expressing (pink) and GFAP-GFP-expressing (green) cells are located immediately below the ventricular surface and are organized as a single layer rather than in multiple layers as in the case of the ventral telencephalon. All nuclei are labeled with the blue stain Draq5 to indicate the ventricular boundary and the Sox2-positive cells (pink) are associated with a long radial process. Note GFAP-GFP surrounding Sox2 positive nuclei (arrows). D: The processes of tg[-3.9nestin:GFP] and GFAP-expressing cells colocalize. Sections were double-immunostained with anti-GFP and -GFAP antibodies followed by nuclear counterstaining with Draq5. Confocal z-section image shows colocalization of both signals in the cytoplasmic processes. In particular, the transgene showing GFAP immunoreactivity can be traced to single soma that line the VZ (arrows). E: tg[-3.9nestin:GFP] cells colocalize with Sox2 at the VZ. Nuclei were labeled with Draq5 (blue). Notably, the matrix of the VZ in the dorsal telencephalon comprises of a thin layer of cells that is marked by Sox2 and nestin:GFP expression. Triple-labeled cells produce a whitish colocalization signal in the nucleus and are surrounded by cytoplasmic GFP. Transverse sections are oriented with dorsal up. Image is a confocal z-section. D, dorsal telencephalic area; TelV, telencephalic ventricle; OB, olfactory bulb. Scale bars = 100 μm in A, 25 μm in B,C, 50 μm in D,E.