
- Title
-
The zebrafish bHLH PAS transcriptional regulator, single-minded 1 (sim1), is required for isotocin cell development
- Authors
- Eaton, J.L., and Glasgow, E.
- Source
- Full text @ Dev. Dyn.

Sim1 is expressed in specific and complex patterns in the embryonic brain. Sim1 mRNA expression was determined by in situ hybridization histochemistry (ISHH). A-C, E, F: Lateral views, dorsal is up and anterior to the left. D: Dorsal view, anterior to the left. The age of the embryos is indicated on each panel in somite (som) stage or hours post fertilization (hpf). The location of the optic recess (or) is indicated by a black bar. t, telencephalon; d, diencephalon; m, midbrain; hy, hypothalamus. EXPRESSION / LABELING:
|
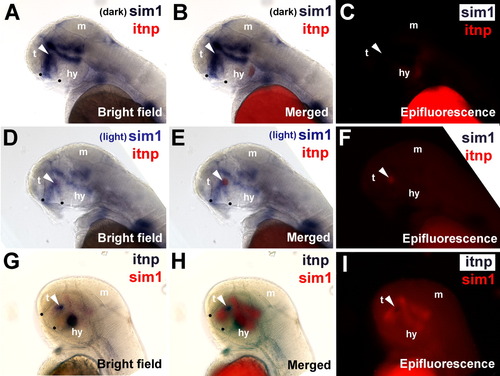
Isotocin cells are located within the sim1 expression domain. Coexpression of sim1 and itnp mRNA was determined by double label in situ hybridization histochemistry (ISHH) in 48-hpf embryos. Dorsal is up and anterior to the left. A, D, G: Bright-field images. C, F, I: The corresponding epifluorescence images. B, E, H: The respective bright field and epifluorescence images merged. A-F: sim1 expression is visualized with purple staining and itnp expression is visualized with red staining (indicated by the white arrowhead). A-C: sim1 is darkly stained, quenching the red itnp staining. D-F: sim1 is lightly stained, revealing the red itnp staining. G-I: The chromogenic staining is reversed such that sim1 expression is visualized with red staining and itnp expression is visualized with purple staining. The locations of the anterior commissure and the post-optic commissure are indicted with black dots. t, telencephalon; m, midbrain; hy, hypothalamus. EXPRESSION / LABELING:
|

Sim1 is coexpressed with dlx2a and expressed along the border of the nkx2.2a domain in the anterior diencephalon. Coexpression of sim1, dlx2a, nkx2.2a, and itnp mRNA was determined by double label in situ hybridization histochemistry (ISHH). A-H: Dorsal is up and anterior to the left. The age of the embryos is indicated on each panel in hours post fertilization (hpf). The identity and color of the probes are indicated on each panel. All images are merged composites of bright field and epifluorescence images. D, H: The itnp expression domain is indicated by the white arrowhead. C, G: The estimated location of isotocin cells is indicated by the open arrowhead. The location of the optic recess (or) is indicated by a black bar. t, telencephalon; d, diencephalon; m, midbrain; hy, hypothalamus. |
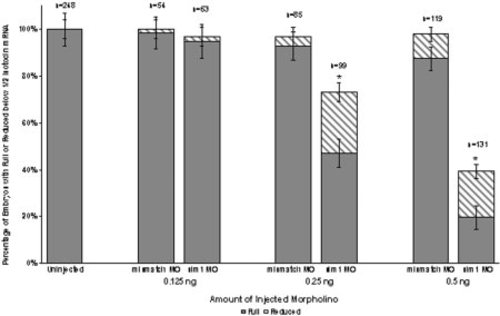
Sim1 knockdown eliminates itnp mRNA expression. Sim1 knockdown by injection of translation inhibiting Morpholino oligonucleotides (MO) significantly disrupts itnp mRNA expression. Three different amounts, 0.125, 0.25, and 0.5 ng/embryo, of sim1 MO and 4-base mismatched “control MO” were injected into one to four cell stage embryos. At 0.25 and 0.5 ng/embryo, sim1 MO injections resulted in a significant elimination of itnp-expressing cells at 52 hpf. Only 47 and 19% of embryos, respectively, maintained full itnp expression following MO disruption at these concentrations (p < 0.0001). Dark grey bars indicate the percentage of embryos with full itnp expression (∼100 cells) following MO injections. Light grey bars indicate the percentage of embryos with reduced itnp expression below ½ of normal (from 1 to ∼50 cells). The number of embryos injected is designated by n. The asterisk indicates statistically significant differences in mean percentage of embryos exhibiting full expression for sim1 MO, from uninjected and “control MO” injected, revealed through a Tukey HSD analysis. PHENOTYPE:
|
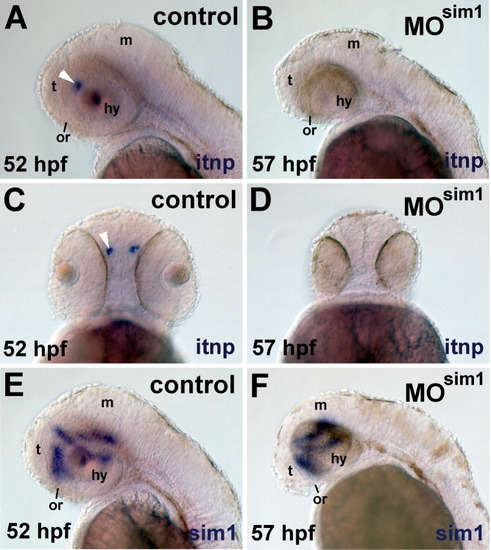
Sim1 is required for itnp mRNA expression. Itnp and sim1 mRNA was detected by ISHH in embryos that were injected with Morpholino oligonucleotides (MO). A,C,E: Embryos injected with 0.5 ng of a 4-base mismatch "control" sim1 MO. B,D,F: Embryos injected with 0.5 ng of sim1 MO (e.g., sim1 morphants, MOsim1). A, B, E, and F are lateral views, dorsal is up and anterior to the left. C and D are ventral views, anterior is up. The probes are indicated on each panel. A,C: The location of the itnp expression domain is indicated with a white arrowhead. The location of the optic recess (or) is indicated by a black bar. t, telencephalon; m, midbrain; hy, hypothalamus. |
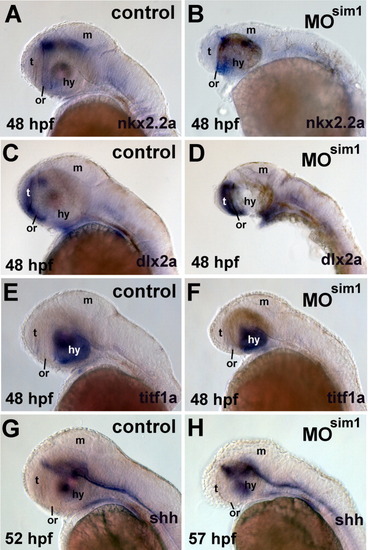
Expression patterns of nkx2.2a, dlx2a, titf1a, and shh are unchanged in sim1 morphants. Nkx2.2a, dlx2a, titf1a, and shh mRNA was detected by ISHH in embryos that were injected with Morpholino oligonucleotides (MO). A,C,E,G: Embryos injected with 0.5 ng of a 4-base mismatch "control" sim1 MO. B,D,F,H: Embryos injected with 0.5 ng of sim1 MO (e.g., sim1 morphants, MOsim1). Dorsal is up and anterior to the left. The age of the embryos is indicated on each panel in hours post-fertilization (hpf). The probes are indicated on each panel. The location of the optic recess (or) is indicated by a black bar. t, telencephalon; m, midbrain; hy, hypothalamus. |