
- Title
-
Fibroblast Growth Factor Receptors Function Redundantly During Zebrafish Embryonic Development
- Authors
- Leerberg, D.M., Hopton, R.E., Draper, B.W.
- Source
- Full text @ Genetics
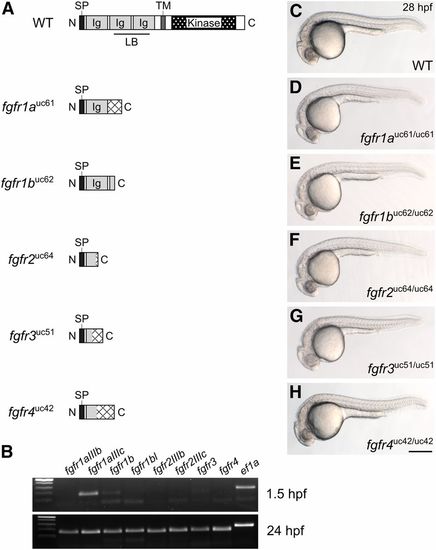
Fgf receptor mutants are embryonic viable. (A) Schematic diagram of a typical full-length Fgfr protein and the predicted truncated peptides resulting from the fgfr1auc61, fgfr1buc62, fgfr2uc64, fgfr3uc51, and fgfr4uc42 alleles. Hatching indicates missense amino acids. (B) RT-PCR of wild-type embryos. While all fgfr isoforms are detected in 24 hr postfertilization (hpf) embryos (postzygotic genome activation, bottom panel), only fgfr1a (isoform IIIc) and fgfr1b are detected in 1.5 hpf embryos (prezygotic genome activation, top panel). ef1a is shown as a positive control. (C–H) Lateral view of ∼28 hpf wild-type (WT, C) or homozygous mutant (D–H) embryos. Anterior is to the left, dorsal is up. Bar in (H), 200 μm for (C–H). Ig, immunoglobulin; LB, ligand-binding domain; SP, signal peptide; TM, transmembrane domain. |

ZFIN is incorporating published figure images and captions as part of an ongoing project. Figures from some publications have not yet been curated, or are not available for display because of copyright restrictions. |

fgfr1a and fgfr1b function redundantly to regulate posterior mesoderm development. (A–D) Lateral view of 30 hpf wild-type (WT; A), and Zfgfr1a;Zfgfr1b (B), Zfgfr1a;MZfgfr1b (C), and MZfgfr1a;Zfgfr1b (D) mutant embryos. Arrowheads denote the notochord; arrows mark pooled blood cells in (B and C). Anterior is to the left, dorsal is up. (E–G) Mesodermal derivative marker analysis of Zfgfr1a;MZfgfr1b and MZfgfr1a;Zfgfr1b double mutant embryos at the 10-somite stage. The notochord (labeled with ta, brown; filled arrowhead) extends down the length of the trunk and tail in wild-type (E) and Zfgfr1a;MZfgfr1b double mutant embryos (F), but is truncated in MZfgfr1a;Zfgfr1b double mutant embryos (G). Defined somites (labeled with myod, purple; open arrowhead) are present in wild-type embryos (E) and Zfgfr1a;MZfgfr1b embryos (F); however, the latter have distinctly fewer somites (5 compared to 10). Although MZfgfr1a;Zfgfr1b mutants retain some myod-positive cells, there are no definitive somites (G). Pronephric precursors (labeled with pax2a, purple; brackets) are restricted to a defined band around the trunk and tail of wild-type embryos (E), a region that is expanded in both Zfgfr1a;MZfgfr1b (F) and MZfgfr1a;Zfgfr1b double mutant embryos (G). Bars: in (D), 200 μm for (A–D); in (G), 50 μm for (E–G). EXPRESSION / LABELING:
PHENOTYPE:
|

fgfr1a, fgfr1b, and fgfr2 function redundantly to regulate pectoral fin development. (A) Model of pectoral fin bud development during pectoral fin bud Induction (top) and Outgrowth (bottom). Underlines denote genes assayed in (C–H). Arrows denote an epistatic (but not direct) link between molecules. Asterisk signifies that Fgf8 has not yet been shown to play this role in zebrafish, but is hypothesized from forelimb work in chick and mouse. (B) Stacked column chart depicting the average number of pectoral fins per animal at 5 dpf, according to genotype. Sample size for each genotype is listed at the top of each bar. Representative images of larvae with 2, 1, or 0 pectoral fins to the right: dorsal views, anterior to the left, with arrowheads denoting pectoral fins where present. (C–H) Fin bud marker analysis of fgfr double and triple mutant embryos at the 18-somite stage (tbx5a, C), 24 hpf (fgf24, D; fgf10a, E), and 44 hpf (fgf24, F; fgf8a, G; dlx2a, H). Whole mount in situ hybridization was performed, embryos were scored for expression, and genotypes were determined post hoc. In each panel, the percentage of embryos expressing particular levels of each marker gene is represented in a stacked column chart on the left, and representative images of those expression levels are shown for each marker to the right (dorsal views, anterior up; developing fin buds are seen as two spots on either side of the embryo, denoted by arrowheads). Bars: in (B), 200 μm; in (C), 50 μm for (C–H). EXPRESSION / LABELING:
PHENOTYPE:
|
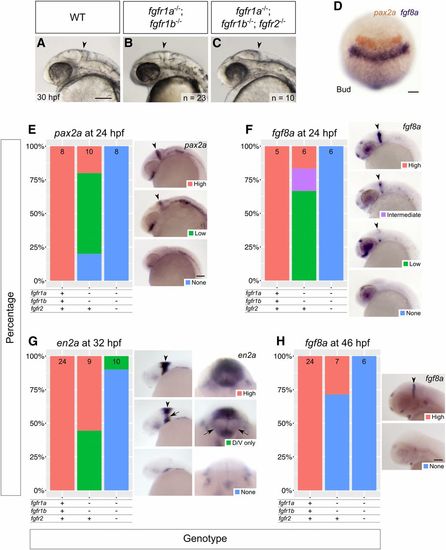
fgfr1a, fgfr1b, and fgfr2 function redundantly to regulate MHB development. (A–C) Lateral view of 30 hpf wild-type (WT, A), and fgfr1a−/−;fgfr1b−/− (B; n = 23), fgfr1a−/−;fgfr1b−/−;fgfr2−/− (C; n = 10) mutant embryos. Arrowheads denote region where the MHB should form. Rostral is to the left, dorsal is up. (D–H) MHB marker analysis of fgfr double and triple mutant embryos at the bud stage (pax2a in brown/fgf8a in purple, D), 24 hpf (pax2a, E; fgf8a, F), 32 hpf (en2a, G), and 46 hpf (fgf8a, H). Whole mount in situ hybridization was performed, embryos were scored for expression, and genotypes were determined post hoc. All embryos had indistinguishable pax2a/fgf8a expression at the bud stage (D; n = 28, 6, 4, for WT, fgfr1a−/−;fgfr1b−/−, and fgfr1a−/−;fgfr1b−/−;fgfr2−/−, respectively). In (E–H), the percentage of embryos expressing particular levels of each marker gene is represented in a stacked column chart on the left (sample size for each genotype is listed at the top of each bar), and representative images of those expression levels are shown for each marker to the right (lateral views, rostral to the left and dorsal up; developing MHBs are denoted by arrowheads). Rightmost images in (G) are magnified frontal views (dorsal up) showing low en2a staining in the left and right regions of the cerebellum (arrows). Bars: in (A), 100 μm for (A–C); in (D), 100 μm; in (E), 100 μm for (E–G); in (H), 100 μm. |

fgfr1a, fgfr1b, and fgfr2 function redundantly to regulate viscerocranial development. (A–C) Lateral views of 5 dpf wild-type (WT, A; n = 12), fgfr1a−/−;fgfr1b−/− (n = 3)/fgfr1a−/−;fgfr1b−/−;fgfr2+/− (B; n = 6), fgfr1a−/−;fgfr1b−/−;fgfr2−/− (C; n = 7) mutant larvae. (A′–C′′) Alcian blue cartilage stains of 5 dpf larvae; arrowheads noting corresponding jaw features between the live larvae in (A–C) and lateral view cartilage mounts in (A′–C ′); m, Meckel’s cartilage; pq, palatoquadrate; hs, hyosymplectic; ch, ceratohyal; op, operculum; cb 1–5, ceratobranchials; t, teeth. (D–F) Pharyngeal arch (D and E) and pouch (F) marker analysis of fgfr double and triple mutant embryos at the 18-somite stage (dlx2a in purple/krox20 in brown labeling rhombomeres 3 (R3) and 5 (R5); D) and 24 hpf (dlx2a, E; alcama; F). Whole mount in situ hybridization was performed, embryos were scored for expression, and genotypes were determined post hoc. All embryos had indistinguishable dlx2a expression at the 18-somite stage (D; n = 7, 26, 6, for WT, fgfr1a−/−;fgfr1b−/−, and fgfr1a−/−;fgfr1b−/−;fgfr2−/−, respectively). In (E and F), the percentage of embryos expressing particular levels of each marker gene is represented in a stacked column chart on the left (sample size for each genotype is listed at the top of each bar), and representative images of those expression levels are shown for each marker to the right (dorsolateral views, rostral to the left and dorsal up; pharyngeal arches (E) and pouches (F) are labeled 1–4. Bars: in (C), 100 μm for (A–C); in (C′′), 100 μm for (A′–C′′); in (D), 50 μm; in (E), 100 μm for (E and F). abs., absent; Ant., Anterior arches/pouches; in (F), ov, otic vesicle; Post., Posterior arches/pouches. |

fgfr1a, fgfr1b, and fgfr2 function redundantly to regulate neurocranial development. (A–C′) Alcian blue cartilage staining of 5 dpf wild-type (WT, A; n = 12), fgfr1a−/−;fgfr1b−/− (B; n = 3), fgfr1a−/−;fgfr1b−/−;fgfr2+/− (n = 6)/fgfr1a−/−;fgfr1b−/−;fgfr2−/− (n = 7) (C and C′) mutant larvae. Notice the variable fusion of the trabeculae (*) in fgfr1a−/−;fgfr1b−/−;fgfr2−/− triple mutants (C and C′) compared to WT (A); full fusion in 3/7 animals, partial fusion in 2/7 animals, no fusion in 2/7 animals. Open arrowheads in (C and C′) denote missing regions of the postchordal neurocranium [compare filled arrowheads in (A)]. (D) Cephalic mesoderm marker analysis of fgfr double and triple mutant embryos at the bud stage using has2. Whole mount in situhybridization was performed, embryos were scored for expression, and genotypes were determined post hoc. The percentage of embryos expressing “High” or “Intermediate” has2expression is represented in a stacked column chart on the left (sample size for each genotype is listed at the top of each bar), and representative images of those expression levels are shown for each marker to the right (dorsal views, rostral to the left; bracket denotes cells specified for cephalic development. (E) Traces of cartilage mounts in (A and C), filled in with expected lineage contributions, adapted with permission from McCarthy et al. (2016). Bars: in (C), 100 μm for (A–C′); in (D), 50 μm. ep, ethmoid plate; pc, postchordal neurocranium. |
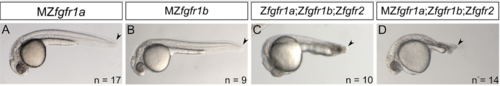
Posterior mesoderm development in MZfgfr1a, MZfgfr1b, and fgfr1a;fgfr1b;fgfr2 triple mutants. (A, B) 30 hpf embreos missing both material and zygotic contributions of fgfr1a (A) or fgfr1b (B) exhibit normal posterior mesoderm development. (C) 24 hpf embryo missing zygotic contributions of fgfr1a, fgfr1b, and fgfr2. Compare to Fig. 3B. (D) 28 hpf embryo missing material and zygotic contributions of fgfr1a and zygotic contributions of fgfr1b and fgfr2. Compare to Fig. 3D. Lateral views; anterior is to the left, dorsal is up. |
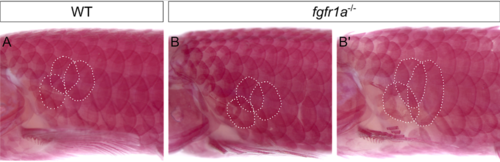
fgfr1a mutants have a variable and subtle defect in scale development. (A-B') Wild-type (A) and fgfr1a (B,B') adults stained with alizarin red. Three similary located scales are outlined in white in each panel. In 2/5 fgfr1a mutants analyzed, scales appeared normal in size (B). In 3/5, however, select flank scales were larger (B'). Anterior is to the left, dorsal is up. |