
Fig. 7
- ID
- ZDB-IMAGE-190913-62
- Genes
- Publication
- Leerberg et al., 2019 - Fibroblast Growth Factor Receptors Function Redundantly During Zebrafish Embryonic Development
- All Figures
- Figures for Leerberg et al., 2019
|
Fig. 7
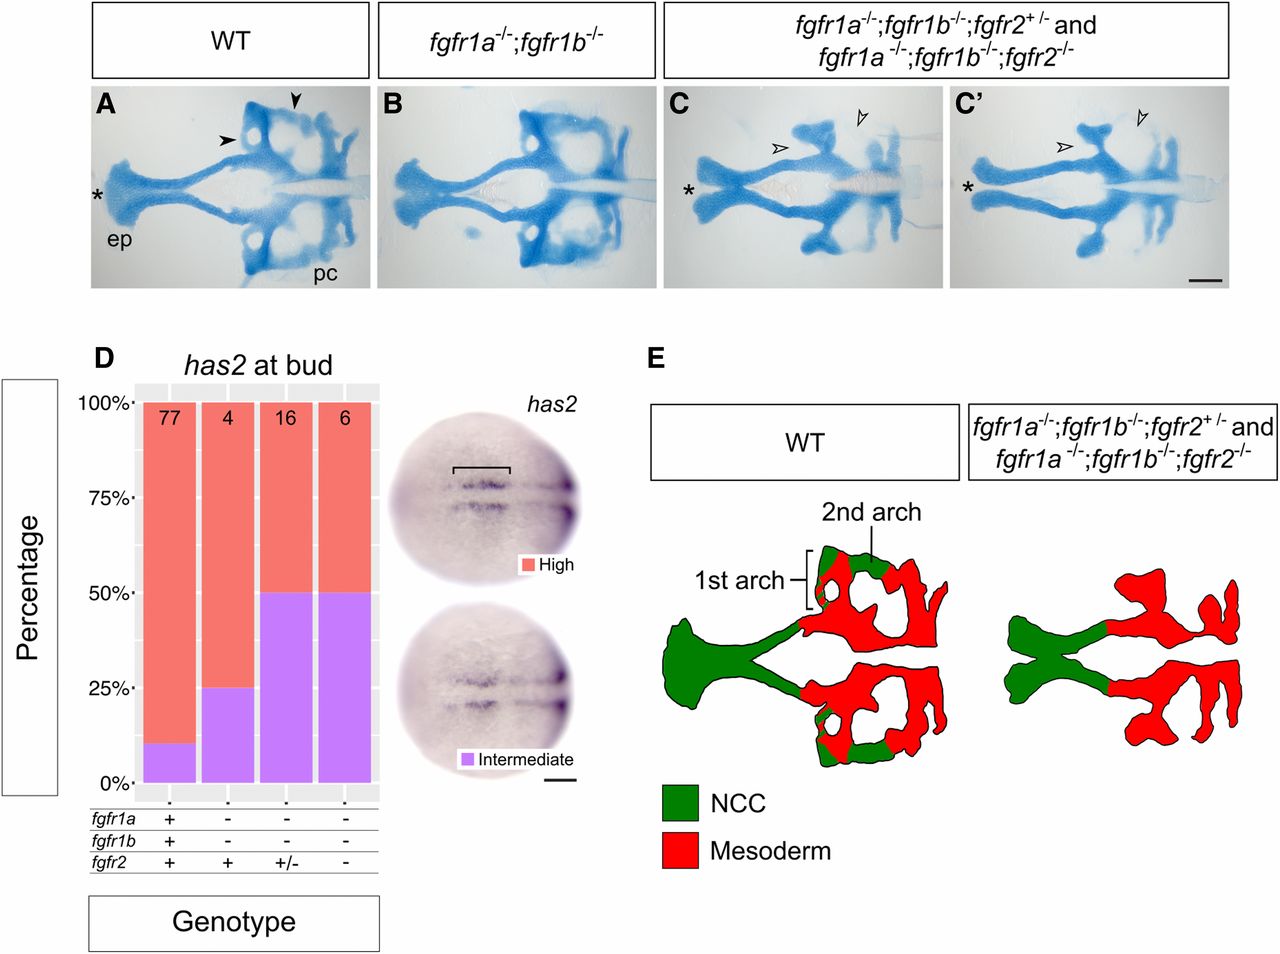
fgfr1a, fgfr1b, and fgfr2 function redundantly to regulate neurocranial development. (A–C′) Alcian blue cartilage staining of 5 dpf wild-type (WT, A; n = 12), fgfr1a−/−;fgfr1b−/− (B; n = 3), fgfr1a−/−;fgfr1b−/−;fgfr2+/− (n = 6)/fgfr1a−/−;fgfr1b−/−;fgfr2−/− (n = 7) (C and C′) mutant larvae. Notice the variable fusion of the trabeculae (*) in fgfr1a−/−;fgfr1b−/−;fgfr2−/− triple mutants (C and C′) compared to WT (A); full fusion in 3/7 animals, partial fusion in 2/7 animals, no fusion in 2/7 animals. Open arrowheads in (C and C′) denote missing regions of the postchordal neurocranium [compare filled arrowheads in (A)]. (D) Cephalic mesoderm marker analysis of fgfr double and triple mutant embryos at the bud stage using has2. Whole mount in situhybridization was performed, embryos were scored for expression, and genotypes were determined post hoc. The percentage of embryos expressing “High” or “Intermediate” has2expression is represented in a stacked column chart on the left (sample size for each genotype is listed at the top of each bar), and representative images of those expression levels are shown for each marker to the right (dorsal views, rostral to the left; bracket denotes cells specified for cephalic development. (E) Traces of cartilage mounts in (A and C), filled in with expected lineage contributions, adapted with permission from McCarthy et al. (2016). Bars: in (C), 100 μm for (A–C′); in (D), 50 μm. ep, ethmoid plate; pc, postchordal neurocranium.