
- Title
-
Notch3 signaling gates cell cycle entry and limits neural stem cell amplification in the adult pallium
- Authors
- Alunni, A., Krecsmarik, M., Bosco, A., Galant, S., Pan, L., Moens, C.B., and Bally-Cuif, L.
- Source
- Full text @ Development
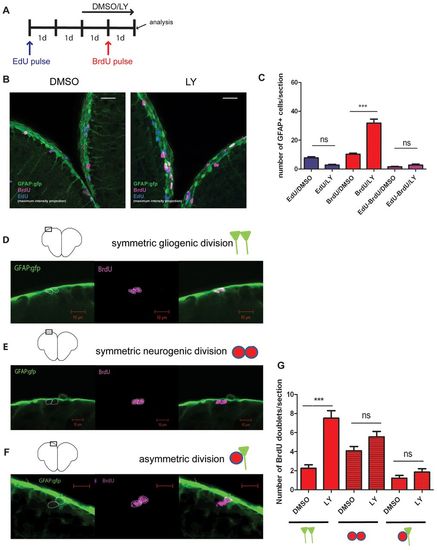
Symmetrically dividing radial glial cells (RG) are recruited into the cell cycle during Notch blockade. (A) Experimental design. An initial cohort of RG in S phase was labeled with an EdU pulse followed by a second pulse of BrdU during Notch blockade (LY). 1d, 1-day intervals. (B) Triple immunostaining showing GFAP- (green), BrdU- (magenta) and EdU- (blue) positive cells in the Dm region of the pallium (confocal projections over 16 and 19 μm, respectively). (C) Quantification of EdU-positive, BrdU-positive and EdU/BrdU-positive RG. Red bars, P<0.0001; blue bars, P=0.07; pink bars, P>1 (n=4 brains for each treatment, total number of cells counted: 1156). (D-G) Division modes of RG and quantification of BrdU-positive doublets in the experimental setting shown in A. Symmetric gliogenic divisions, P<0.0001; other division modes, P>1; n=273 doublets counted. Scale bars: white, 20 μm; red 10 μm. |

Notch invalidation triggers continuous overgrowth of the pallial GZ through RG amplification. (A-E) Cross-sections of the pallial ventricular zone following different length of LY411575 treatment (d, days of treatment) stained for the RG marker GFAP-GFP (green) and the proliferation marker MCM5 (magenta). (F) Percentage of RG in cycle (GFAP/MCM5 positive) during LY treatment. (G) Total number of RG (GFAP positive). **P<0.005; ***P<0.0001 (n=4 brains for each condition). Scale bars: 20 μm. Confocal projections of four optical planes (each 1 μm). |

Individual RG cells maintain stem cell properties after Notch blockade. (A) Experimental design. (B-K) Single optical section of the pallial ventricular zone in gfap:gfp transgenic brains, triple labeled for GFP (RG, green), CldU (magenta) and HuC/D (gray). (C-F) High magnification of the area boxed in B; example of a self-renewing, symmetric gliogenic division. (H-K) High magnification of the area boxed in G; example of a self-renewing and asymmetric division. Scale bars: yellow, 20 μm; white, 2 μm. |
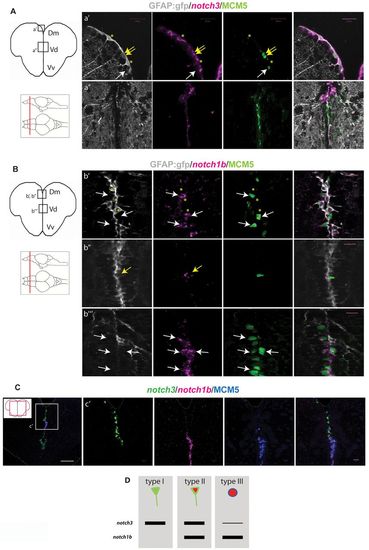
notch3 and notch1b are differentially expressed in adult pallial progenitors. (A) notch3 expression revealed by fluorescent in situ hybridization (magenta) on telencephalic cross-sections of a gfap:gfp brain, together with a double fluorescent immunostaining for GFP (RG, gray) and MCM5 (green). (a2) Dorsomedial (Dm) region of the pallium, notch3 expression is found in quiescent (type I) (yellow asterisks) and proliferating (type II) (yellow arrows) RG. Transcripts are absent from type III cells (white arrows). (a2) Pallial-subpallial junction, enriched in type III cells: notch3 expression is very low or absent. (B) notch1b expression (magenta) compared with GFAP-GFP (RG, gray) and MCM5 (green). (b2,b2) Dm; white and yellow arrows indicate notch1b-positive type II RG (b2) and type III progenitors (b2), respectively. Transcripts are absent from quiescent RG (b2, yellow asterisks). (b22) Pallial-subpallial junction: notch1b is strongly expressed in type III cells. (C) Double fluorescent in situ hybridization for notch3 (green) and notch1b (magenta) with immunostaining for MCM5 (blue). (c2) High magnification of the pallial-subpallial junction: notch3 is expressed by RG cells of Dm and notch1b by type III progenitors. (D) Graphic representation of notch3 and notch1b expression in the different progenitor cell types (according to März et al., 2010). In Dm, notch3 is expressed by 97% of type I cells (n=229 cells counted), 88% of type II cells (n=31 cells) and 2% of type III cells(n=23 cells); notch1b is expressed by 2.8% of type I cells (n=141 cells), 90% of type II cells (n=43 cells) and 85% of type III cells. Scale bars: white, 100 μm; magenta, 20 μm. Single optical confocal planes, 1 μm. EXPRESSION / LABELING:
|
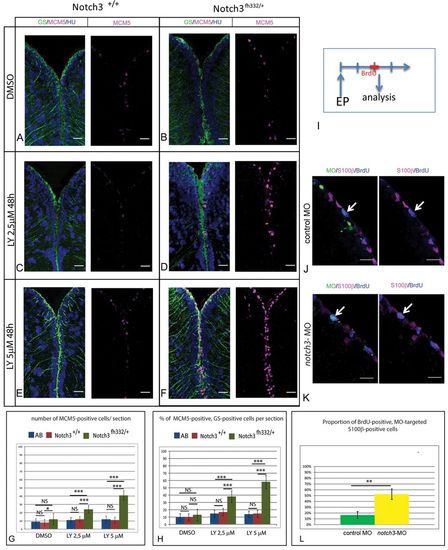
Notch3 inhibition accounts for the effect of Notch blockade on RG activation. (A-F) Triple immunohistochemistry for the RG marker glutamine synthetase (GS, green), MCM5 (magenta) and HuC/D (blue) on telencephalic cross-sections from adult notch3+/+ siblings and notch3fh332/+ heterozygotes under control conditions (top row) or upon LY treatment (middle and bottom rows). Scale bar: 20 μm. Confocal projection images from four optical planes, each 1 μm thick. (G,H) Total number of MCM5-positive progenitors per section (G) and proportion of RG cells in proliferation (H) in the different genotypes and treatment conditions, as well as in the standard AB wild-type line. P<0.0001 (n=3 brains for AB, notch3+/+ and notch3fh332/+, respectively). (I) Schematic of the notch3-MO knock-down experiment: a BrdU pulse is applied 2 days after electroporation (EP) of fluorescein-labeled notch3-MO or control-MO in pallial ventricular cells. Brains are analyzed immediately. (J,K) Analysis of the proliferation status (anti-BrdU) (blue) of electroporated (fluorescein-positive) (green) RG (anti-S100β) (magenta), assessed by immunocytochemistry. Arrows indicate fluorescein-labeled radial glia BrdU-positive cells. Scale bar: 20 μm. Confocal projection images from four optical planes, each 1 μm thick. (L) Proportion of BrdU-positive cells within the radial glia MO-targeted population. P<0.001 (n=3 brains for each condition). |
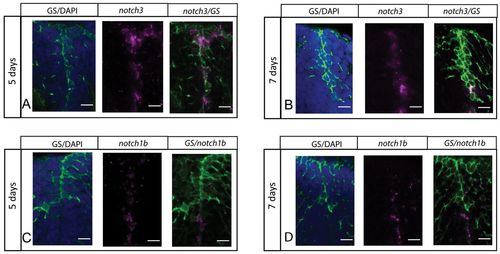
notch3 expression, but not notch1b, characterizes RG of the juvenile zebrafish pallium. (A-D) Fluorescent in situ hybridization (magenta) for notch3 (A,B) or notch1b (C,D), and immunocytochemistry for the RG marker GS (green) (blue: DAPI), on cross-sections of the pallium at 5 and 7 dpf. Scale bars: 10 μm. Confocal projection images from four optical planes, each 1 μm thick. |

Notch3 promotes NSC quiescence and limits amplifying divisions in the juvenile pallium. (A-D) Cross-sections of the pallial ventricular zone at 5 (C,D) and 7 (A,B) dpf stained for the RG marker BLBP (green) and the proliferation marker PCNA (magenta) (gray: DAPI) in notch3fh332/fh332 homozygous mutants (B,D) and notch3+/+ siblings (A,C). White arrows at 7 dpf indicate quiescent RG. (E-G) Total number of proliferating cells (PCNA), RG (BLBP) and proliferating RG (PCNA/BLBP) per section at 7 dpf (E) and 5 dpf (F), and proportion of proliferating RG (G). (H-K) Cross-sections of the pallial ventricular zone at 5 (H,I) and 7 (J,K) dpf stained for the RG markers BLBP or GS (green) and for BrdU (magenta) (gray: DAPI) in notch3fh332/fh332 homozygous mutants (I,K) and notch3+/+ siblings (H,J). 7 dpf animals were pulsed with BrdU at 5 dpf and chased for 2 days. White arrows indicate BrdU-positive cells that remain as RG in mutants. (L,M) Total number of BrdU-positive cells (BrdU), RG (BLBP or GS) and BrdU-positive RG (BrdU/BLBP or BrdU/GS) per section at 5 dpf immediately after the BrdU pulse (L) and after 2 days of chase (M). *P<0.05; **P<0.005; ***P<0.0001 (n=3 for both notch3+/+ and notch3fh332/fh332 fish). Scale bars: 10 μm. Confocal projection images from four optical planes, each 1 μm thick. |
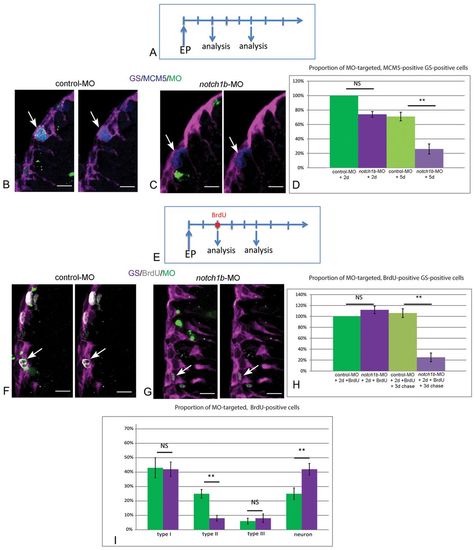
Notch1b is required for the maintenance of progenitor division and fate. (A) Schematic of the notch1b-MO knock-down experiment: brains are analyzed 2 and 5 days after electroporation of fluorescein-labeled notch1b-MO or control-MO in pallial ventricular cells. (B,C) Analysis of the proliferation status (anti-MCM5) (blue) of electroporated (fluorescein-positive) (green) RG (anti-GS) (magenta), assessed by immunocytochemistry 5 days after electroporation. Arrows indicate proliferating RG, usually notch1b-MO-negative. (D) Proportion of MCM5-positive, GS-positive cells within the MO-targeted population, 2 days (P=0.05) and 5 days (**P<0.001) after electroporation (n=3 brains for each condition). (E) Schematic of the fate analysis in notch1b-MO knock-down experiments: a BrdU pulse is applied 2 days after electroporation of fluorescein-labeled notch1b-MO or control-MO in pallial ventricular cells. Brains are analyzed immediately or after a 3-day chase. (F,G) Analysis of BrdU labeling (white) in electroporated (fluorescein-positive) (green, arrows) RG (anti-GS) (magenta), assessed by immunocytochemistry after a 3-day chase. Arrows indicate fluorescein-labeled BrdU-positive cells in control-MO (glial cells F) and in notch1b-MO (G). (H) Proportion of BrdU-positive, GS-positive cells within the MO-targeted population, 2 days (P=0.05) and 5 days (**P<0.001) after electroporation (n=3 brains for each condition). (I) Proportion of type I (GS positive, MCM5 negative), type II (GS positive, MCM5 positive), type III (GS negative, MCM5 positive) and non-progenitor cells (GS negative, MCM5 negative) [presumably neurons, which virtually constitute the only non-progenitor cell type generated from the pallial GZ (Chapouton et al., 2010; Rothenaigner et al., 2011)] within the BrdU-positive MO-targeted population 5 days after electroporation (type II, neurons: **P<0.001) (n=3 brains for each condition). Scale bars: 10 μm. Confocal projection images from four optical planes, each 0.5 μm thick. |
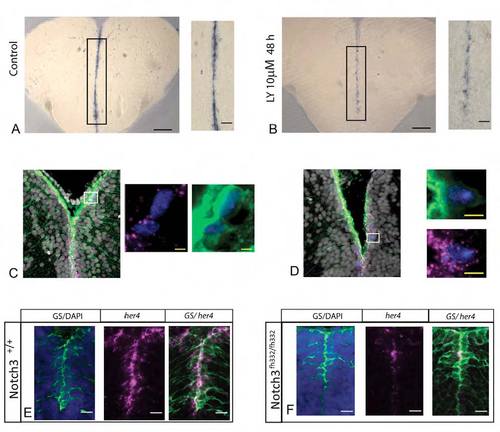
her4.1 expression depends on Notch signaling in adult pallial RG, and is a Notch3 target in RG of the juvenile pallium. |

Sustained RG proliferation following LY treatment. (A) Experimental design. RG cells in S phase were labelled using BrdU at the end of a 7-day LY treatment and their fate was analyzed 3 days later. (B) Triple immunohistochemistry for GFP (RG, green), BrdU (magenta) and MCM5 (blue) in telencephalic cross-sections of a gfap:gfp transgenic fish. Some RG in proliferation at the end of the LY treatment (BrdU/GFP-positive cells) are still in proliferation 3 days later (white arrows, BrdU/GFP/MCM5-positive cells). Scale bar: 10 μm. |
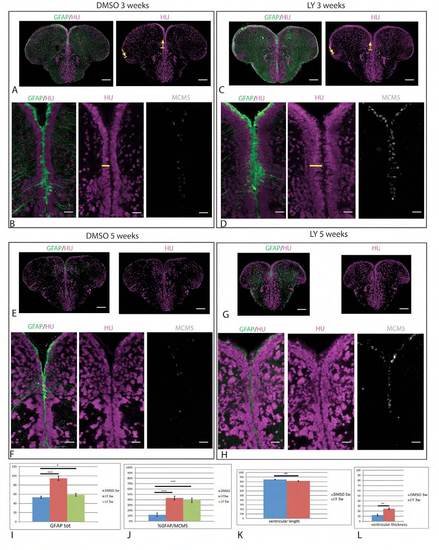
LY treatments of 3 and 5 weeks highlight a regulation of RG amplification but the maintenance of a NSC zone. (A-H) Cross-sections of the adult pallial ventricular zone in gfap:gfp transgenic brains processed in triple immunocytochemistry for the detection of GFP (RG, green), HuC/D (magenta) and MCM5 (gray). Adult fish were continuously treated with LY (or DMSO for controls) for 3 weeks (A-D) or 5 weeks (E-H). Low magnification panels (A,C) were used to measure the pallial ventricular surface (between arrows, see K). The horizontal yellow bar in B,D indicates the width of the subventricular neuronal domain. Scale bar: 10 μm. Confocal projection images from four optical planes. (I,J) Quantification of the total number of RG cells per section (I) and the proportion of RG in proliferation (J) following control (blue), 3-week (red) or 5-week (green) treatments. (K,L) Quantification of the pallial ventricular length (K) and width of the subventricular neuronal population (L) following control (blue) and 3-week (red) treatments. *P<0.05; **P<0.001; ***P<0.0001 (n=3 brains for each condition). |

At the population level, RG remain self-renewing and multipotent upon Notch blockade. (A) Experimental design to test for self-renewal. (B) Cross-section of the adult pallial ventricular zone in a gfap:gfp transgenic brain, triple labeled for GFP (RG, green), CldU (magenta) and MCM5 (blue); white arrows indicate RG cells in proliferation after 48 hours of Notch blockade and still in proliferation at the end of treatment. (C) Experimental design to test for bipotency. (D) Cross-section of the adult pallial ventricular zone in a gfap:gfp transgenic brain, triple labeled for GFP (green), CldU (magenta) and the neuronal marker HuC/D (blue). Some RG cells in proliferation 2 days after the onset of Notch blockade (GFAP/CldU-positive) generated neurons (yellow arrows) and nondividing RG cells (white arrow). Scale bar: 10 μm. Confocal projection images from four optical planes. |
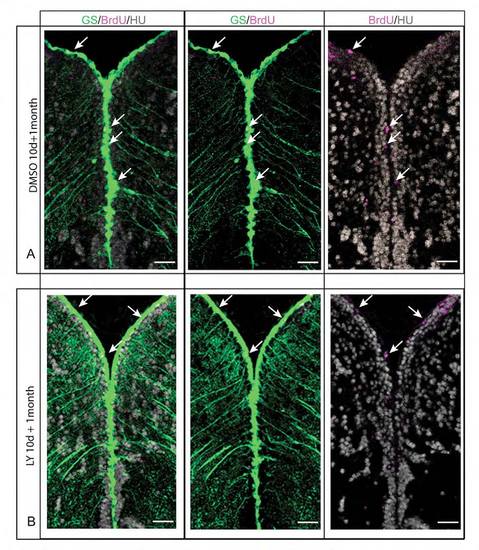
The NSC population of the pallial germinal zone is intact following a 10-day LY treatment. (A,B) Triple immunohistochemistry for GS (RG, green), BrdU (magenta) and HuC/D (gray) on telencephalic cross-sections in control fish (A) and LY-treated fish (B) one month after a 10-day treatment. One month after the LY treatment the morphology of the ventricular zone is indistinguishable in treated and control fish, with a similar number of BrdU-positive RG in both cases (white arrows). All pictures are confocal projection images from four optical planes, each 1 mm thick. Scale bar: 20 μm. |
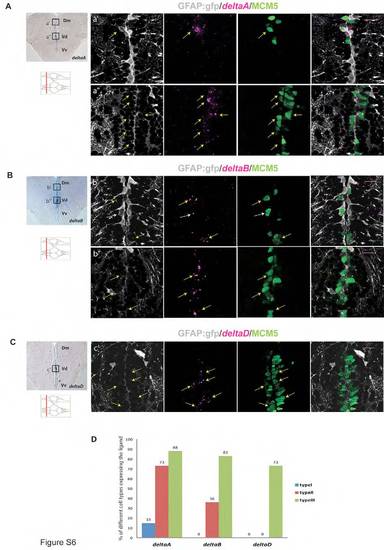
Differential expression of delta ligand genes within the pallial germinal zone. (A) Cross-section at the level indicated on the scheme showing the distribution of deltaA mRNA (in situ hybridization, blue). Boxed areas are illustrated from sections triple-stained for deltaA (fluorescent in situ hybridization, magenta), GFP (RG, immunocytochemistry, gray) and MCM5 (immunocytochemistry, green). a2 and a22 deltaA is expressed by proliferating RG (type II cells, yellow arrow, first panel) in the dorsomedial region of the pallium (Dm), and proliferating neuronal precursors (GFAP negative, MCM5 positive) (type III cells) at the pallial-subpallial junction (yellow arrows, second panel). (B) Cross-section at the level indicated on the scheme showing the expression of deltaB mRNA (in situ hybridization, blue). Boxed areas are illustrated from sections triple stained as above but with the deltaB probe (magenta). (b2,b22) deltaB is expressed by type III cells (yellow arrows, first panel) and proliferating RG (type II cells, white arrow, first panel) in Dm, and by type III cells at the pallial-subpallial junction. (C) Cross-section at the level indicated on the scheme showing the expression of deltaD mRNA. The boxed area is illustrated from a section triple stained as above but with the deltaD probe (magenta). (c2) deltaD expression is found exclusively on type III cells at the pallial-subpallial junction. (D) Quantification of the percentage of different cell types in terms of delta expression (n=665 cells). Scale bars: 20 μm. All pictures are single optical planes. |
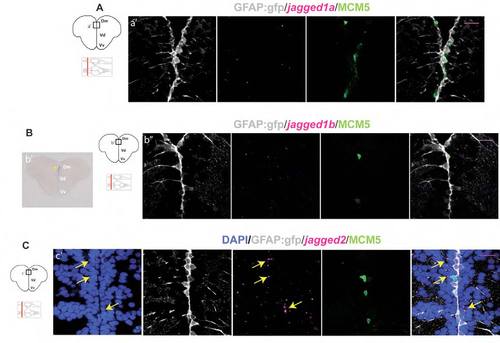
In situ hybridization for the Notch ligand genes jagged in the adult zebrafish telencephalon. (A) Cross-section at the level indicated on the scheme and processed for fluorescent in situ hybridization with the jagged1a probe. No specific mRNA expression was found at the ventricular zone in Dm. (B) Cross-section at the level indicated, showing in situ hybridization for jagged1b either revealed by the blue chromogen NBT/BCIP without proteinase K treatment (b2) or by Fast Red (magenta) coupled with immunohistochemistry against GFP (RG, gray) and MCM5 (green) (b22). Blue staining reveals very weak jagged1b expression at the ventricular zone of Dm (b2, yellow arrow). When revealed in fluorescence and subsequently processed for immunohistochemistry, this low level of expression is not sufficient to assign jagged1b mRNA to any specific cell type (b22). (C) Cross-section at the level indicated on the scheme showing in situ hybridization for jagged2 (magenta) coupled with immunohistochemistry against GFP (RG, gray) and MCM5 (green). DAPI (blue) is used as a counterstaining to visualize all cell nuclei. mRNA expression is scattered in Dm and Vv regions of the telencephalon. Denser staining is observed in the first cell layer of Dm (yellow arrows) immediately adjacent to the gfap:gfp-positive RG that line the ventricle (gray). Scale bars: 20 μm. All pictures are single optical planes. |