
Fig. S7
- ID
- ZDB-IMAGE-130907-15
- Publication
- Alunni et al., 2013 - Notch3 signaling gates cell cycle entry and limits neural stem cell amplification in the adult pallium
- All Figures
- Figures for Alunni et al., 2013
|
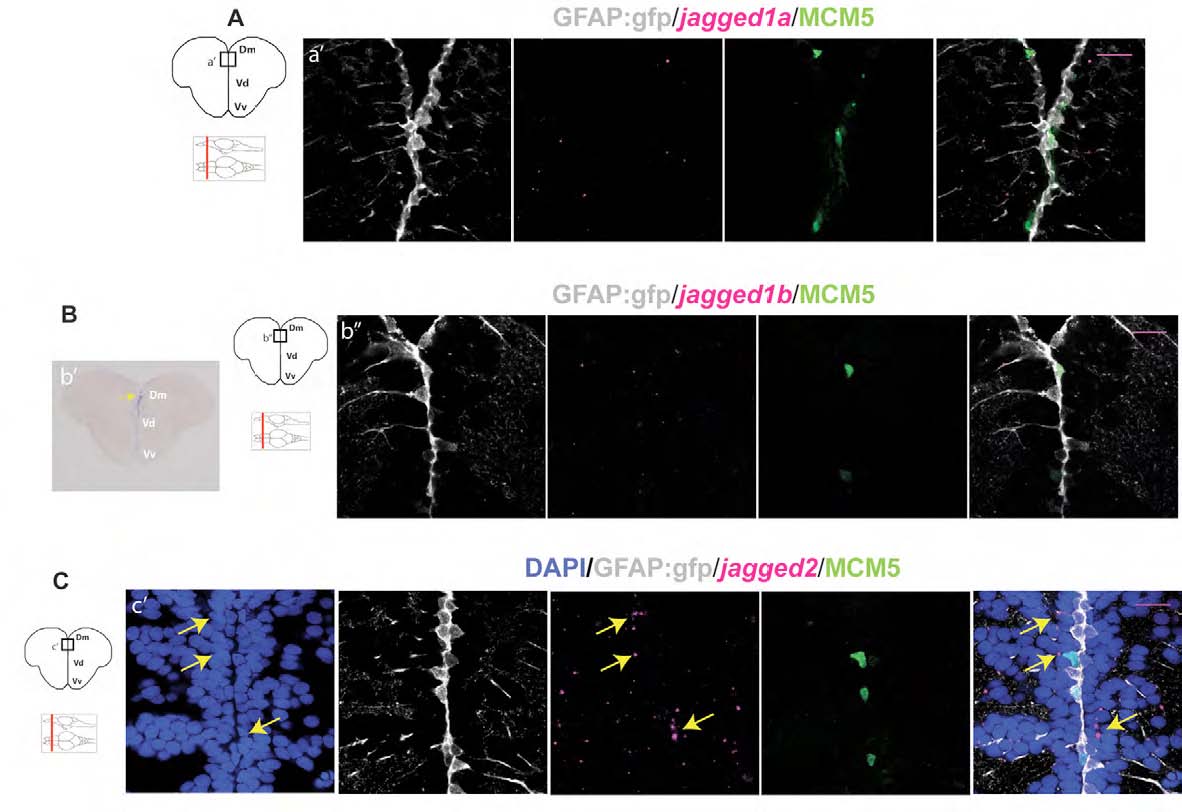
Fig. S7
In situ hybridization for the Notch ligand genes jagged in the adult zebrafish telencephalon. (A) Cross-section at the level indicated on the scheme and processed for fluorescent in situ hybridization with the jagged1a probe. No specific mRNA expression was found at the ventricular zone in Dm. (B) Cross-section at the level indicated, showing in situ hybridization for jagged1b either revealed by the blue chromogen NBT/BCIP without proteinase K treatment (b2) or by Fast Red (magenta) coupled with immunohistochemistry against GFP (RG, gray) and MCM5 (green) (b22). Blue staining reveals very weak jagged1b expression at the ventricular zone of Dm (b2, yellow arrow). When revealed in fluorescence and subsequently processed for immunohistochemistry, this low level of expression is not sufficient to assign jagged1b mRNA to any specific cell type (b22). (C) Cross-section at the level indicated on the scheme showing in situ hybridization for jagged2 (magenta) coupled with immunohistochemistry against GFP (RG, gray) and MCM5 (green). DAPI (blue) is used as a counterstaining to visualize all cell nuclei. mRNA expression is scattered in Dm and Vv regions of the telencephalon. Denser staining is observed in the first cell layer of Dm (yellow arrows) immediately adjacent to the gfap:gfp-positive RG that line the ventricle (gray). Scale bars: 20 μm. All pictures are single optical planes.