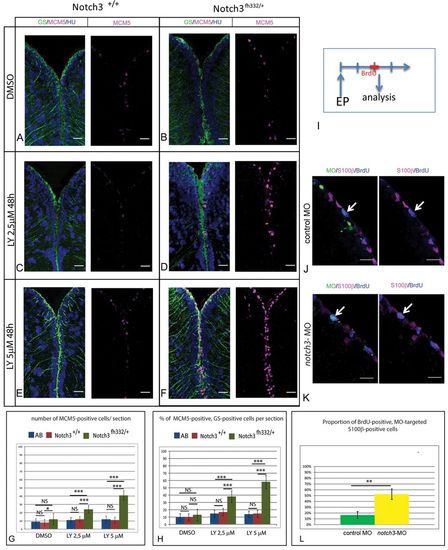
Notch3 inhibition accounts for the effect of Notch blockade on RG activation. (A-F) Triple immunohistochemistry for the RG marker glutamine synthetase (GS, green), MCM5 (magenta) and HuC/D (blue) on telencephalic cross-sections from adult notch3+/+ siblings and notch3fh332/+ heterozygotes under control conditions (top row) or upon LY treatment (middle and bottom rows). Scale bar: 20 μm. Confocal projection images from four optical planes, each 1 μm thick. (G,H) Total number of MCM5-positive progenitors per section (G) and proportion of RG cells in proliferation (H) in the different genotypes and treatment conditions, as well as in the standard AB wild-type line. P<0.0001 (n=3 brains for AB, notch3+/+ and notch3fh332/+, respectively). (I) Schematic of the notch3-MO knock-down experiment: a BrdU pulse is applied 2 days after electroporation (EP) of fluorescein-labeled notch3-MO or control-MO in pallial ventricular cells. Brains are analyzed immediately. (J,K) Analysis of the proliferation status (anti-BrdU) (blue) of electroporated (fluorescein-positive) (green) RG (anti-S100β) (magenta), assessed by immunocytochemistry. Arrows indicate fluorescein-labeled radial glia BrdU-positive cells. Scale bar: 20 μm. Confocal projection images from four optical planes, each 1 μm thick. (L) Proportion of BrdU-positive cells within the radial glia MO-targeted population. P<0.001 (n=3 brains for each condition).
|
