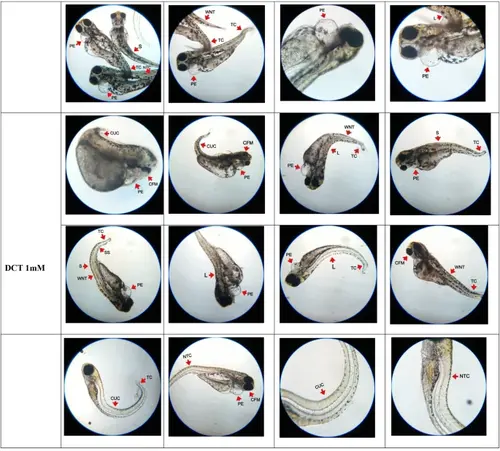
Representative images of developing embryos at 120 hpf in groups exposed to different concentrations of DCT. Figure illustrates the developmental process of embryos at 120 hpf in groups exposed to DCT ranging from concentration 250 µM to 1mM (n=20). In comparison to the control group, the embryos exposed to DCT showed multiple developmental defects in both cranial and caudal portion of neural tube.The deformities in developing neural tube are indicated by arrow marks. The deformities specifiedin group exposed to DCT 250 µM were kyphosis (K), spinal split (SS) and wavy neural tube (WNT). The deformities specified in group exposed to DCT 500 µM were pericardial edema (PE), lordosis (L), curly-up tail curvature (CUC), scoliosis (S), tail curvature (TC), craniofacial malformation (CFM), wavy neural tube (WNT) and neural tube curvature (NTC). The deformities specified in group exposed to DCT 750 µM were tail curvature (TC), pericardial edema (PE), neural tube curvature (NTC), curly-up tail curvature (CUC), pericardial edema (PE), spinal split (SS), curly-up tail curvature (CUC), lordosis (L), scoliosis (S) and wavy neural tube (WNT). The deformities specified in group exposed to DCT 1mM were curly-up tail curvature (CUC), pericardial edema (PE), craniofacial malformation (CFM), pericardial edema (PE), lordosis (L), tail curvature (TC), wavy neural tube (WNT), scoliosis (S), spinal split (SS) and neural tube curvature (NTC)
|
