|
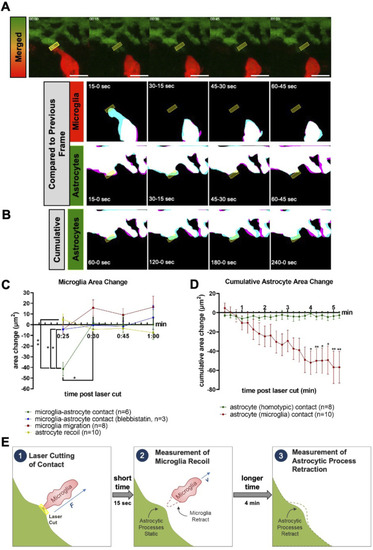
Microglia and astrocytic process recoil after laser severance of contact sites. (A) Diagram of laser-induced microglial recoil away from astrocytic contacts and slower retraction of astrocytic processes. (B) Time-lapse images of microglia (red) and astrocytes (green) after laser ablation (upper, up to 1 min post-ablation), with area masks overlaid between adjacent time points for microglia (middle) and astrocytes (lower). (C) Cumulative area masks of astrocytes for 1–4 min post-ablation. (B, D) Change in area after laser ablation for microglia that were contacting astrocytes (green, n = 6), blebbistatin-treated microglia contacting astrocytes (blue, n = 3), microglial migration (red, n = 8), and astrocytes that were contacting microglia (yellow, n = 10). Area change represents the difference between T(n + 1) and Tn as shown in (B) as magenta and blue, respectively. (E) Cumulative area change for astrocytes with homotypic (green, n = 8) or microglial (red, n = 6) contacts after ablation. Area change represents the total area changed between T0 and the given time point. Statistics were assessed by two-way ANOVA with Šídák’s multiple comparison test, *P < 0.05, **P < 0.01. All scale bars represent 10 μm, and all ablation sites are marked with yellow boxes on montages.
|