|
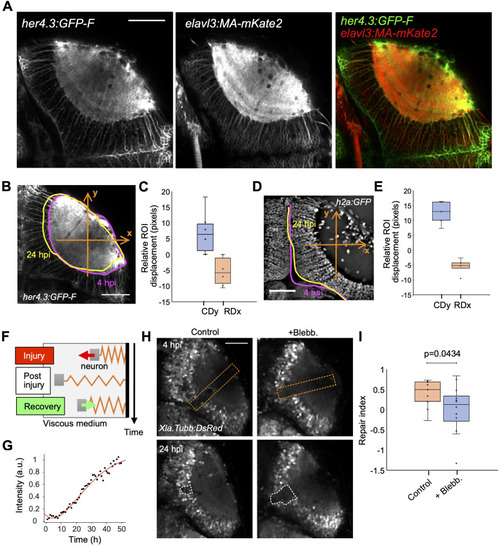
Optic tectum wounds close via tissue deformation. (A) Fluorescence images of a Tg(her4.3:GFP-F); Tg(elavl3:MA-mKate2) fish at 4 dpf. (B) Measurement of the neuropil contour deformation using Tg(her4.3:GFP-F); Tg(elavl3:MA-mKate2) larvae. Deformation is measured along the axes shown (orange arrows). (B, C) Boxplot representation of the neuropil contour deformation measured in (B) (n = 6), represented on the caudal (y-axis, CDy, blue) and rostral (x-axis, RDx, orange) axes. (D) Deformation quantification using the PVZ boundary in Tg(h2a:GFP) larvae. (D, E) Boxplot representation of the deformation measurements as performed in (D) (n = 6). (F) Model of viscoelastic dynamics of neuron displacement comprising three phases (see Supplemental Information). (G) Example of experimental wound closure curve (black dots) fitted by the model (red curve). (H) Example images of injured optic tectum of control and blebbistatin-treated Tg(Xla.Tubb:DsRed) animals at 7 and 24 hpi. The orange dashed lines show the position of the injury. The white dashed lines show the analysis regions for calculating the repair index. (I) Quantification of the repair index (RI) for control (n = 9) and blebbistatin-treated (n = 12) fish. t test, P < 0.05. Box plots show the median, box edges represent the 25th and 75th percentiles, and whiskers show the full data range. Scale bars represent 50 μm on all images. All quantifications are between 4 and 24 hpi unless otherwise stated.
|