IMAGE

Figure 6.

ID
ZDB-IMAGE-241021-30
Source
Figures for El-Daher et al., 2024
Image
Figure Caption

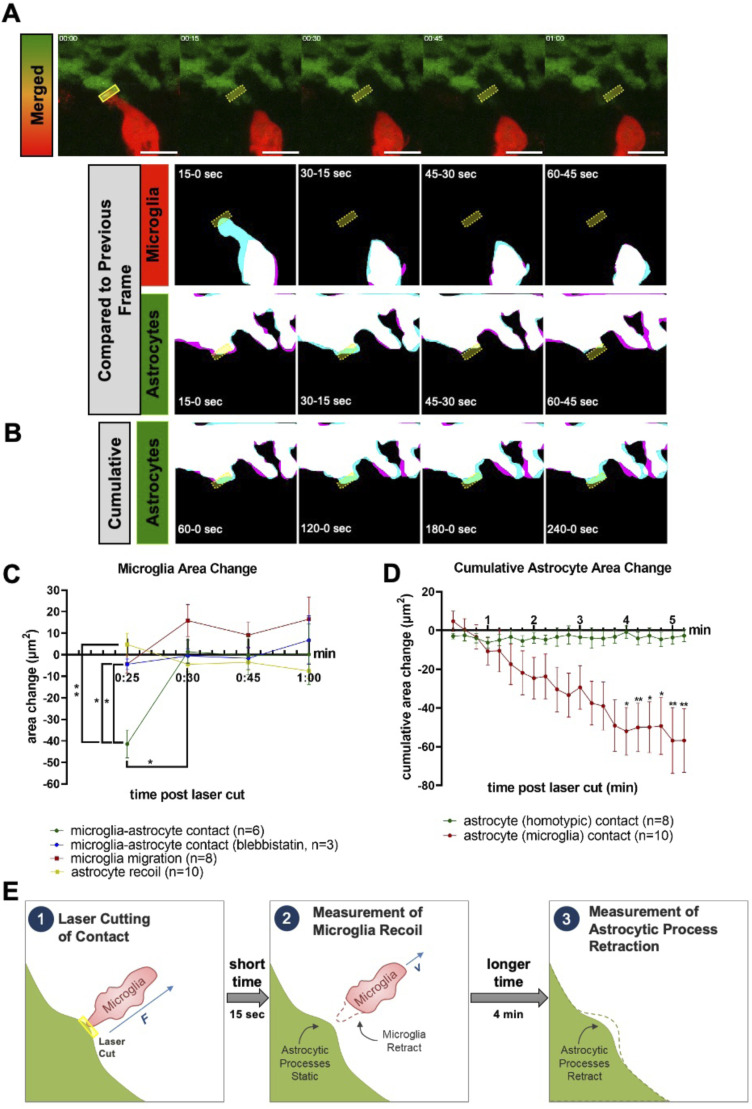
Figure 6. Microglia and astrocytic process recoil after laser severance of contact sites.

(A) Diagram of laser-induced microglial recoil away from astrocytic contacts and slower retraction of astrocytic processes. (B) Time-lapse images of microglia (red) and astrocytes (green) after laser ablation (upper, up to 1 min post-ablation), with area masks overlaid between adjacent time points for microglia (middle) and astrocytes (lower). (C) Cumulative area masks of astrocytes for 1–4 min post-ablation. (B, D) Change in area after laser ablation for microglia that were contacting astrocytes (green, n = 6), blebbistatin-treated microglia contacting astrocytes (blue, n = 3), microglial migration (red, n = 8), and astrocytes that were contacting microglia (yellow, n = 10). Area change represents the difference between T(n + 1) and Tn as shown in (B) as magenta and blue, respectively. (E) Cumulative area change for astrocytes with homotypic (green, n = 8) or microglial (red, n = 6) contacts after ablation. Area change represents the total area changed between T0 and the given time point. Statistics were assessed by two-way ANOVA with Šídák’s multiple comparison test, *P < 0.05, **P < 0.01. All scale bars represent 10 μm, and all ablation sites are marked with yellow boxes on montages.

Acknowledgments
This image is the copyrighted work of the attributed author or publisher, and ZFIN has permission only to display this image to its users. Additional permissions should be obtained from the applicable author or publisher of the image. Full text @ Life Sci Alliance