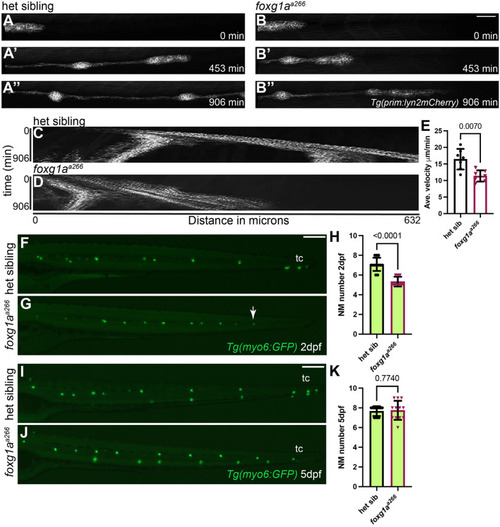
Loss of Foxg1a results in slower posterior lateral line primordium migration and delayed neuromast formation. (A-B″) Confocal projections of time lapse video of posterior lateral line migration primordium at 0, 453, and 906 min in heterozygous (A-A″) and foxg1aa266 mutant embryos (B-B″). Scale bar: 100 µm. (C,D) Kymograph of time lapse video of posterior lateral line migration in heterozygous (C) and foxg1aa266 mutant embryos (D). (E) Quantification of average primordium velocity during migration, n=7 embryos per condition. (F,G) Live images of Tg(myo6:GFP)-labeled neuromasts in heterozygous (F) and foxg1aa266 mutant embryos (G) at 2 dpf, white arrow indicates location of truncated primordium migration and terminal cluster neuromasts at the end of the tail are indicated by tc. (H) Quantification of NM number at 2 dpf, n=12 embryos per condition. (I,J) Live images of Tg(myo6:GFP)-labeled neuromasts at 5 dpf in heterozygous (I) and foxg1aa266 mutant larvae (J). (K) Quantification of NM number at 5 dpf, n=12 larvae per condition. Data presented as mean±s.d., Mann–Whitney U-test. Scale bars: 20 µm.
|
