FIGURE SUMMARY
Title

foxg1a is required for hair cell development and regeneration in the zebrafish lateral line

Authors
Bell, J.M., Turner, E.M., Biesemeyer, C., Vanderbeck, M.M., Hendricks, R., McGraw, H.F.
Source
Full text @ Biol. Open

RNA in situ hybridization shows foxg1a expression in developing and regenerating posterior lateral line tissue. (A-D) Wholemount RNA in situ hybridization of foxg1a in wild-type zebrafish posterior lateral line primordium at 28 hpf (A), and in neuromasts at 2 dpf (B), 5 dpf (C), and 8 dpf (D). (F-G) Wholemount RNA in situ hybridization of foxg1a in wild-type zebrafish neuromasts during regeneration following neomycin (NEO) exposure at 5 dpf. (E) 3 h post-NEO, (F) 1-day post-NEO, and (G) 3 days post-NEO. (H-J′) Confocal projections of wild-type neuromasts showing hair cells labeled with Tg(myo6:GFP) (green), foxg1a expression with HCR fluorescent in situ hybridization (red) and nuclei labeled with DAPI (blue) at 5 dpf (H), 1 day-post NEO exposure (I), and 3 days-post NEO (J). Quantification of HCR foxg1a fluorescence intensity in arbitrary units (A.U.) in the whole neuromasts (K), hair cells (hc; K′), and support cells (sc; K″). n=15 NMs (nine larvae) 5 dpf, n=16 NMs (nine larvae) 1 day-post NEO, and n=18 NMs (nine larvae) 3 days-post NEO). All data presented at mean±s.d. Kruskal–Wallis test with Dunn's multiple comparisons. Scale bars: 20 µm.

Loss of Foxg1a results in slower posterior lateral line primordium migration and delayed neuromast formation. (A-B″) Confocal projections of time lapse video of posterior lateral line migration primordium at 0, 453, and 906 min in heterozygous (A-A″) and foxg1aa266 mutant embryos (B-B″). Scale bar: 100 µm. (C,D) Kymograph of time lapse video of posterior lateral line migration in heterozygous (C) and foxg1aa266 mutant embryos (D). (E) Quantification of average primordium velocity during migration, n=7 embryos per condition. (F,G) Live images of Tg(myo6:GFP)-labeled neuromasts in heterozygous (F) and foxg1aa266 mutant embryos (G) at 2 dpf, white arrow indicates location of truncated primordium migration and terminal cluster neuromasts at the end of the tail are indicated by tc. (H) Quantification of NM number at 2 dpf, n=12 embryos per condition. (I,J) Live images of Tg(myo6:GFP)-labeled neuromasts at 5 dpf in heterozygous (I) and foxg1aa266 mutant larvae (J). (K) Quantification of NM number at 5 dpf, n=12 larvae per condition. Data presented as mean±s.d., Mann–Whitney U-test. Scale bars: 20 µm.

Loss of Foxg1a function reduces hair cell development and regeneration. (A) Timeline of FM1-43FX exposure and live imaging at 5 dpf. (B-C″) Live confocal projections of Tg(myo6:GFP)-labeled (green) and FM1-43FX-labeled (magenta) neuromasts in heterozygous (B-B″) and foxg1aa266 mutant larvae (C-C″) at 5 dpf, white arrows indicate co-labeling of myo6:GFP and FM1-43FX and green arrowheads indicate only myo6:GFP labeling. (D-D″) Quantification of myo6(GFP)+ hair cells (D), FM1-43FX+ hair cells (D′), and the percentage of FM1-43FX+ hair cells (D″) at 5 dpf. n=17 neuromasts (11 larvae) heterozygous sibling and n=19 neuromasts (ten larvae) foxg1aa266 mutants. (E) Timeline of FM1-43FX exposure and live imaging at 8 dpf. (F-G″) Live confocal projections of Tg(myo6:GFP)-labeled (green) and FM1-43FX-labeled (magenta) neuromasts in heterozygous (F-F″) and foxg1aa266 mutant larvae (F-G″) at 8 dpf. (H-H″) Quantification of myo6(GFP)+ hair cells (H), FM1-43FX+ hair cells (H′), and the percentage of FM1-43FX+ hair cells (H″) at 8 dpf. n=16 neuromasts (eight larvae) heterozygous sibling and n=17 neuromasts (nine larvae) foxg1aa266 mutants. (I) Time line of NEO-exposure, regeneration, and FM1-43 labeling. (J-K″) Live confocal projections of Tg(myo6:GFP)-labeled (green) and FM1-43FX-labeled (magenta) neuromasts in heterozygous (J-J″) and foxg1aa266 mutant larvae (K-K″) following regeneration at 8 dpf. (L-L″) Quantification of Tg(myo6:GFP)+ hair cells (L), FM1-43FX+ hair cells (L′), and the percentage of FM1-43FX+ hair cells (L″) following regeneration. n=14 neuromasts (seven larvae) heterozygous sibling and n=15 neuromasts (eight larvae) foxg1aa266 mutants. (M-N′″) Confocal projections of 8 dpf larvae showing hair cells labeled with α-Oto antibody (green), support cells labeled with α-Sox-2 antibody (red), and nuclei labeled with DAPI in heterozygous sibling (M-M′″) and foxg1aa266 (N-N′″) neuromasts. (O-O″) Quantification of α-Oto+, α-Sox-2 +, and DAPI+ cells. n=19 neuromasts (ten larvae) heterozygous sibling and n=20 neuromasts (ten larvae) foxg1aa266 mutants. (P-Q′″) Confocal projects of 8dpf larvae following NEO-exposure and regeneration showing hair cells labeled with α-Oto antibody (green), support cells labeled with α-Sox-2 antibody (red), and nuclei labeled with DAPI in heterozygous sibling (P-P′″) and foxg1aa266 (Q-Q′″) neuromasts. (R-R″) Quantification of regenerated α-Oto+, α-Sox-2 +, and DAPI+ cells. n=17 neuromasts (nine larvae) heterozygous sibling and n=18 neuromasts (nine larvae) foxg1aa266 mutants. Data presented as mean ±s.d., Mann–Whitney U-test. Scale bars: 20 µm.

BrdU incorporation in foxg1a mutants is reduced during neuromast maturation. (A) Timeline of BrdU incorporation between 2 dpf and 5 dpf. (B-C′″-E,F′″,H-I′″,L-M′″) Confocal projections of heterozygous sibling and foxg1aa266 embryos expressing Tg(myo6:GFP) (green) following 24 h windows of BrdU (red) exposure and nuclei labeled with DAPI (blue) between 2-5 dpf. White arrows indicate representative myo6:GPF+ hair cells co-labeled with BrdU. Yellow arrowheads indicate representative neuromast cells labeled with BrdU. (B-B′″) 3 dpf heterozygous sibling and (C-C′″) foxg1aa266 mutant neuromast exposed to BrdU from 2-3 dpf. (D-D″) Quantification of heterozygous sibling and foxg1aa266 hair cells (D), total BrdU incorporation (D′), and percent of BrdU to hair cells (D″) at 3 dpf. n=17 neuromasts (nine larvae) heterozygous sibling, n=16 neuromasts (eight larvae) foxg1aa266. (E-F′″) 4 dpf heterozygous sibling (E-E′″) and foxg1aa266 mutant (F-F′″) neuromasts exposed to BrdU from 3-4 dpf. (G-G″) Quantification of heterozygous siblings and foxg1aa266 hair cells (G), total BrdU incorporation (G′), and index of BrdU to hair cells (G″) at 4 dpf. n=19 neuromasts (nine larvae) heterozygous sibling, n=15 neuromasts (eight larvae) foxg1aa266. (H-I′″) 5 dpf heterozygous sibling (H-H′″) and foxg1aa266 mutant (I-I″) neuromasts exposed to BrdU from 4-5 dpf. (J-J″) Quantification of heterozygous siblings and foxg1aa266 hair cells (J), total BrdU incorporation (J′), and index of BrdU to hair cells (J″) at 5dpf. n=15 neuromasts (eight larvae) heterozygous sibling, n=17 neuromasts (eight larvae) foxg1aa266. (K) Timeline of NEO expose at 5 dpf, followed by 24 h of BrdU incubation and then regeneration through to 8 dpf and fixation. (L-M′″) Confocal projections at 3 days-post NEO treatment at 8 dpf; hair cells and labeled with Tg(myo6:GFP) (green), proliferating cells are labeled by BrdU-incorporation (red), and nuclei labeled with DAPI (blue) in heterozygous sibling (L-L′″) and foxg1aa266 mutant (M-M′″) neuromasts. (N-N″) Quantification of hair cells (N), BrdU-labeled cells (N′), and % of BrdU+ hair cells (N″). n=21 neuromasts (7 larvae) per condition. All data presented at mean±s.d. Mann–Whitney U-tests. Scale bars: 20 µm.

Support cell populations are unaffected by loss of Foxg1a during development. (A) Schematic of a neuromast showing peripheral mantle cells (blue), dorsoventral cells (purple), and anterior-posterior cells (yellow). (B) Timeline of UV photo-conversion of nlsEos and fixation of larvae at 5 dpf. (C-C′) Confocal projection of photo-converted Tg(sfrp1a:nlsEos)-expressing support cells in 5 dpf heterozygous sibling (C) and foxg1aa266 larvae (C′). (D) Quantification of Tg(sfrp1a:nlsEos)-positive dorsoventral support cells. n=14 neuromasts (eight larvae) heterozygous sibling, n=13 neuromasts (six larvae) foxg1aa266. (E-E′) Confocal projection of Tg(sost:nlsEos)-expressing dorsoventral support cells in 5 dpf heterozygous sibling (E) and foxg1aa266 larvae (E′). (F) Quantification of Tg(sost:nlsEos)-positive dorsoventral support cells. n=23 neuromasts (eight larvae) per condition. (G-G′) Confocal projections of FISH HCR for tnfsf10l3 in 5 dpf heterozygous sibling (G) and foxg1aa266 larvae (G′). (H) Quantification of tnfsf10l3+ cells. n=17 neuromasts (eight larvae) heterozygous, n=11 neuromasts in foxg1aa266. (I) Timeline of photo-conversion and regeneration to 8 dpf after NEO-exposure at 5 dpf. (J-J′) Confocal projection of photo-converted Tg(sfrp1a:nlsEos)-expressing support cells in 8 dpf heterozygous sibling (J) and foxg1aa266 larvae (J′). (K) Quantification of Tg(sfrp1a:nlsEos)-positive support cells. n=22 neuromasts (eight larvae) heterozygous sibling, and n=27 neuromasts (ten larvae) foxg1aa266. (L-L′) Confocal projection of photo-converted Tg(sost:nlsEos)-expressing dorsoventral support cells in 8 dpf heterozygous sibling (L) and foxg1aa266 larvae (L′). (M) Quantification of Tg(sost:nlsEos)-positive support cells. n=28 neuromasts (ten larvae) heterozygous sibling, n=27 neuromasts (nine larvae) foxg1aa266. (N-N′) Confocal projections of HCR fluorescent in situ for tnfsf10l3 in 8 dpf heterozygous sibling (N) and foxg1aa266 larvae (N′). (O) Quantification of tnfsf10l3+ cells. n=20 neuromasts (ten larvae) heterozygous sibling larvae, and n=11 neuromasts in seven foxg1aa266 larvae. All quantification data presented as mean±s.d. Mann–Whitney U-test. Scale bars: 20 µm.

RNA in situ hybridization of NM cell markers. DIC images of wholemount RNA in situ hybridization showing mRNA expression in NMs at 5 dpf in heterozygous sibling (het sib) and foxg1aa266 larvae, lower lefthand numbers indicate the number of larvae with expression in neuromasts over the total number analyzed. Central cell markers: isl1a expression in 11/12 het sib (A) and 1/14 foxg1aa266 larvae (A′), six1a expression in 13/13 het sib (B) and 12/12 foxg1aa266 larvae (B′), six1b expression in 11/11 het sib (C) and 11/11 foxg1aa266 larvae (C′), and gata2a expression in 7/7 het sib (D) and 7/7 foxg1aa266 larvae (D′). Dorsoventral and anterior-posterior (DV/AP) cell markers: sost expression in 11/11 het sib (E) and 9/10 foxg1aa266 larvae (E′) and tnfs10l3 expression in 11/11 het sib (F) and 7/8 fox1gaa266 larvae (F′). Expression of Notch/Delta pathways markers: notch3 expression in 10/11 het sib (G) and 10/10 foxg1aa266 larvae (G′), her7 expression in 4/7 het sib (H) and 5/7 foxg1aa266 larvae (H′), her4.1 expression in 7/7 het sib (I) and 7/7 foxg1aa266 larvae (I′), lfng expression in 4/6 het sib (J) and 6/6 foxg1aa266 larvae (J′), deltaD expression in 10/12 het sib (K) and 10/10 foxg1aa266 larvae (K′), and atoh1a expression in 11/12 het sib (L) and 7/8 foxg1aa266 larvae (L′). Canonical Wnt pathway: wnt10a expression in 8/10 het sib (M) and 9/13 foxg1aa266 larvae (M′), wnt2 expression in 6/6 het sib (N) and 7/7 foxg1aa266 larvae (N′), and ctnnb1 expression in 6/6 het sib (O) and 7/9 foxg1aa266 larvae (O′). Scale bars: 20 µm.

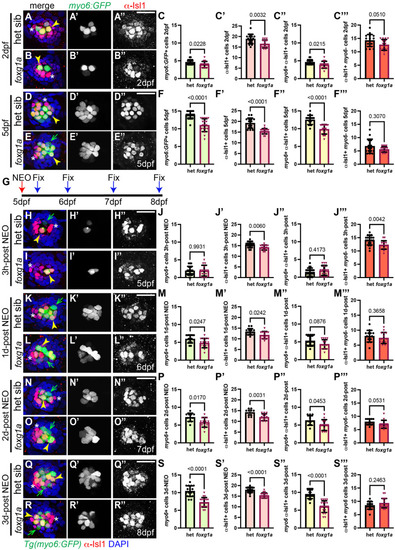
α-Islet1 antibody-labeled cells are reduced in foxg1aa266 mutants during development and regeneration. Confocal projections of neuromasts showing hair cells labeled with myo6:GFP (green), central cells and hair cells labeled with α-Isl1 antibody (red), and nuclei labeled with DAPI (blue). Examples of hair cells that are both myo6:GFP+ and α-Isl1+ are marked with yellow arrowheads, hair cells that are myo6:GFP+ and α-Isl1- are marked by green arrows, and cells that are α-Isl1+ and myo6:GFP- are marked with white asterisks. (A-B″) Heterozygous sibling and foxg1aa266 mutants neuromasts at 2 dpf. (C-C′″) Quantification of myo6:GFP+ hair cells, α-Isl1+ cells, cells labeled with both myo6:GFP and α-Isl1, and cells labeled with only α-Isl1, n=17 NMs (nine embryos) heterozygous siblings and 15 NMs (eight embryos) foxg1aa266 mutants. (D-E″) Heterozygous sibling and foxg1aa266 mutant neuromasts at 5 dpf. (F-F′″) Quantification of myo6:GFP+ hair cells, α-Isl1+ cells, cells labeled with both myo6:GFP and α-Isl1, and cells labeled with only α-Isl1, n=16 neuromasts (eight larvae) heterozygous siblings and 18 neuromasts (nine larvae) foxg1aa266 mutants. (G) Timeline of NEO exposure at 5 dpf and fixation at 3 h-post NEO (5 dpf), 1 day-post NEO (6 dpf), 2 days-post NEO (7 dpf), and complete regeneration (8 dpf). (H-I″) Heterozygous sibling and foxg1aa266 mutants neuromasts at 3 h-post NEO (5 dpf). (J-J′″) Quantification of myo6:GFP+ hair cells, α-Isl1+ cells, cells labeled with both myo6:GFP and α-Isl1, and cells labeled with only α-Isl1, n=20 neuromasts (ten larvae) heterozygous siblings and 15 neuromasts (eight larvae) foxg1aa266 mutants. (K-L″) Heterozygous sibling and foxg1aa266 mutant neuromasts at 1 day-post NEO (6 dpf). (M-M′″) Quantification of myo6:GFP+ hair cells, α-Isl1+ cells, cells labeled with both myo6:GFP and α-Isl1, and cells labeled with only α-Isl1, n=14 neuromasts (seven larvae) heterozygous siblings and 15 neuromasts (eight larvae) foxg1aa266 mutants. (N-O″) Heterozygous sibling and foxg1aa266 mutants neuromasts at 2 days-post NEO (7 dpf). (P-P′″) Quantification of myo6:GFP+ hair cells, α-Isl1+ cells, cells labeled with both myo6:GFP and α-Isl1, and cells labeled with only α-Isl1, n=11 neuromasts (seven larvae) heterozygous siblings and 13 neuromasts (eight larvae) foxg1aa266 mutants. (Q-R″) Heterozygous sibling and foxg1aa266 mutants neuromasts at complete regeneration NEO (8 dpf). (S-S′″) Quantification of myo6:GFP+ hair cells, α-Isl1+ cells, cells labeled with both myo6:GFP and α-Isl1, and cells labeled with only α-Isl1, n=17 neuromasts (nine larvae) heterozygous siblings and 19 neuromasts (nine larvae) foxg1aa266 mutants. All data presented at mean±s.d., Mann–Whitney U-test. Scale bars: 20 µm.

α-Islet1 antibody and sost:nlsEos label differentially label regenerating hair cells. Confocal projections of neuromasts showing hair cells labeled with myo6:GFP (green), central cells and hair cells labeled with α-Isl1 antibody (red), and sost:nlsEos cells (blue). Examples of hair cells that are both myo6:GFP+ and sost:nlsEos are marked with cyan arrows, hair cells that are both myo6:GFP+ and α-Isl1+ are marked with yellow arrowheads, hair cells that are myo6:GFP+, α-Isl1+, and sost:nlsEos+ are marked by white arrows, and cells that are α-Isl1+ and sost:nlsEos+ are marked with purple asterisks. (A) Timeline of UV photoconversion of sost:nlsEos cells at 5 dpf, homeostasis for 3 days, and fixation at 8 dpf. (B-C′″) Heterozygous sibling and foxg1a266 mutants neuromasts at 8 dpf. (Di-Dvii) Quantification of myo6:GFP+ hair cells (Di), α-Isl1+ cells (Dii), sost:nlsEos+ cells (Diii) cells labeled with both myo6:GFP and α-Isl1 (Div), hair cells labeled with myo6:GFP and sost:nlsEos (Dv), cells labeled with sost:nlsEos and α-Isl1 (Dvi), and cells labeled with myo6:GFP, α-Isl1, and sost:nlsEos (Dvii), n=15 neuromasts (eight larvae) heterozygous siblings and 14 neuromasts (eight larvae) foxg1a266 mutants. (E) Timeline of UV photoconversion of sost:nlsEos cells and NEO exposure at 5 dpf, regeneration for 3 days, and fixation at 8 dpf. (F-G′″) Heterozygous sibling and foxg1a266 mutants neuromasts at 8 dpf. (Hi-Hvii) Quantification of myo6:GFP+ hair cells (Hi), α-Isl1+ cells (Hii), sost:nlsEos+ cells (Hiii) cells labeled with both myo6:GFP and α-Isl1 (Hiv), hair cells labeled with myo6:GFP and sost:nlsEos (Hv), cells labeled with sost:nlsEos and α-Isl1 (Hvi), and cells labeled with myo6:GFP, α-Isl1, and sost:nlsEos (Hvii), n=15 neuromasts (eight larvae) heterozygous siblings and 14 neuromasts (nine larvae) foxg1a266 mutants. All data presented at mean±s.d. Significance was determined with Mann–Whitney U-tests. Scale bars: 20 µm.

Acknowledgments
This image is the copyrighted work of the attributed author or publisher, and ZFIN has permission only to display this image to its users. Additional permissions should be obtained from the applicable author or publisher of the image. Full text @ Biol. Open